
One of the earliest personal research projects for me using Dynamo was the concept of automating the traditional feasibility study process in architecture. When working on commercial and multi-family residential projects, developer clients often explore several properties to see which have the most potential for financial returns on investment. The client typically requires a feasibility report in a matter of days or even hours to quickly give insight on whether to pursue a property or not. To provide this data often requires me to maximize our efficiency within the time allotted.
The feasibility study process is highly repetitive and ripe for automation. Regardless of the site; conditions such as lot size, zoning, code requirements, public right-of-ways, and various other factors set constraints that can serve as a starting point a parametric model. Once built in Dynamo, a multitude of inputs can be flexed to explore different outcomes. More often than not the developer is looking for total area, number of levels, specific program mixture, floor-area-ratio (FAR), and other factors to create pro formas and evaluate the financial viability of pursuing the project. Having a flexible, easy-to-adjust parametric model allows for rapid test fits and option generation. Emerging web and data visualization tools further enable sharing and input with team members and clients.
In August of 2015, my colleague Jason Weldon and I made a first pass at building an approach using Dynamo based on experiences we had encountered in practice. This first Dynamo definition was error-prone but built a foundational understanding of how to structure for parametricism and how the resultant information could be extracted to satisfy the typical deliverable. It was this baseline project that inspired a second round of research for a presentation at Architecture Boston eXpo 2016. In preparation for ABX, we made the decision to specifically utilize a tool set readily available to most architecture offices: Revit, Dynamo, Excel, PowerBI, and web visualization.
The first step was to develop a system in Dynamo that could apply setbacks to any edge of a property shape regardless of size, angles, direction, and other characteristics of the geometry. The original attempt at this project revealed that using visible geometry -- points, lines, surfaces, solids -- was unreliable and at times computationally taxing. In Dynamo there are currently tools to evenly offset a shape in a chosen direction but there is not an easy way to pick and choose some edges to offset while keeping others in their original location. The most efficient approach would be to use vector calculations and plot the new corner point coordinates provided the property boundary lines and desired offset distances.

For any given corner, this mathematical strategy calculates the offset distance along the adjacent/opposite angles (SOH-CAH-TOA) and plots the new point location. After each corner is repositioned, a brand new polygon is established that represents the maximum build area for that site.
This Dynamo definition now becomes a universal mechanism for applying setbacks to any property shape. Polygons from software platforms such as Revit, Adobe Illustrator, or CAD can be fed into Dynamo to begin a feasibility analysis. As a test, I created an array of various 6-sided polygons and applied a different offset to 2 of the 6 sides. The resultant shapes could then be extruded to a maximum allowable height and produce floor plates at a set floor-to-floor heights in order to assess the total area of each site.

Once the foundation was established for a Dynamo approach, we kicked off a case study by looking at the criteria of fitness for evaluating what constitutes a satisfactory design outcome. Factors like density, usable area, design aesthetic, budget, and function all play an important role in the success of a project and it is crucial to set targets early on. A sample site was chosen and a list of site assumptions were compiled to begin establishing Dynamo constraints.
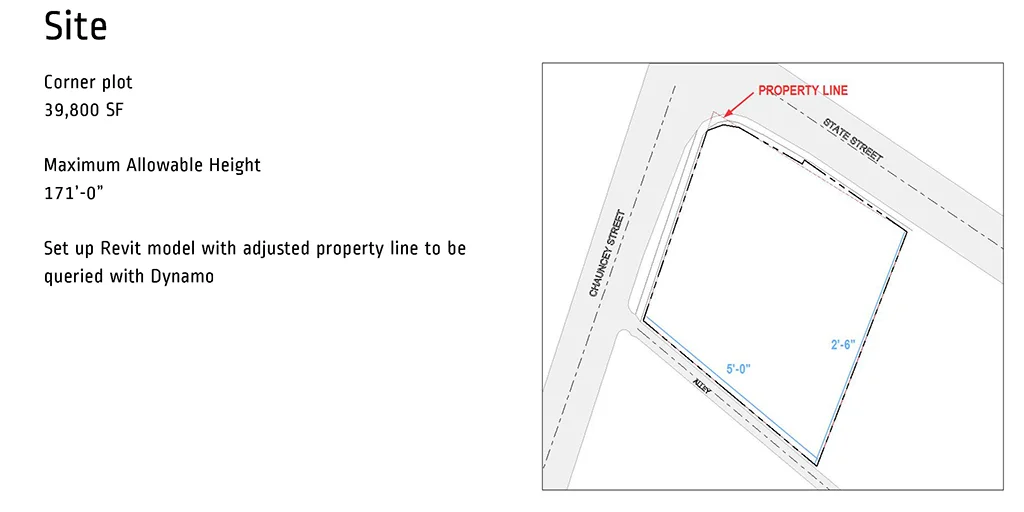

From this property shape we decided to isolate and compare 3 schemes for their proximity to a target FAR -- thus revealing the most efficient design. The steps in Dynamo included applying the required setbacks to the property boundary, specifying the maximum building width to allow for circulation and residential unit size, generating floor plates for as many level as can fit within the maximum allowable building height, and locating the corridor and means of egress, which will eventually be subtracted from the overall residential area.
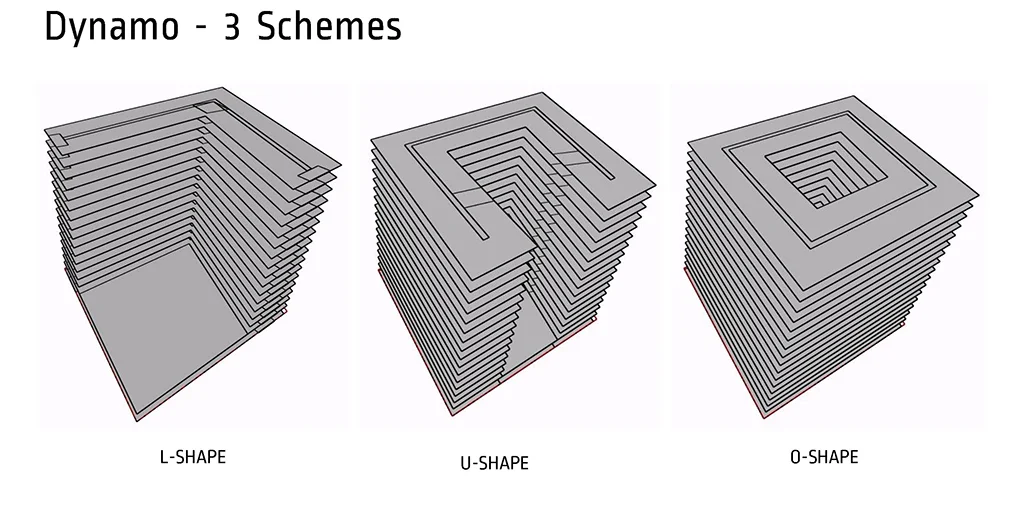
Creating a flexible and reliable Dynamo definition paves the way for further analysis and visualization. The file can be posted to the Dynamo Customizer -- a shareable web interface where others can orbit around the 3D model and change the input sliders to adjust the geometry real-time. The Customizer is an excellent way to keep team members or clients up-to-date with the latest schemes or elicit feedback to allow them more agency in the design process. Another powerful tool that can be used -- Project Fractal -- runs your Dynamo definition through the cloud to analyze a design space of possible inputs and help the designer determine the configurations that best meet the criteria of fitness. For this case study we put the U-shape scheme in Project Fractal to test which arrangement of input dimensions results in a total Gross Area closest to the target FAR (without going over).
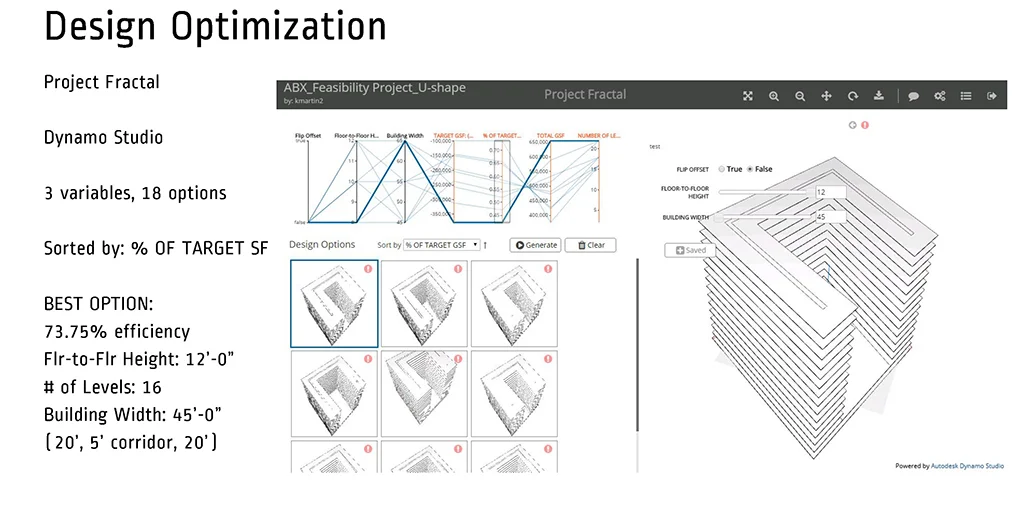
Check out this Project Fractal visualization for yourself HERE (must sign in with an Autodesk ID to access).
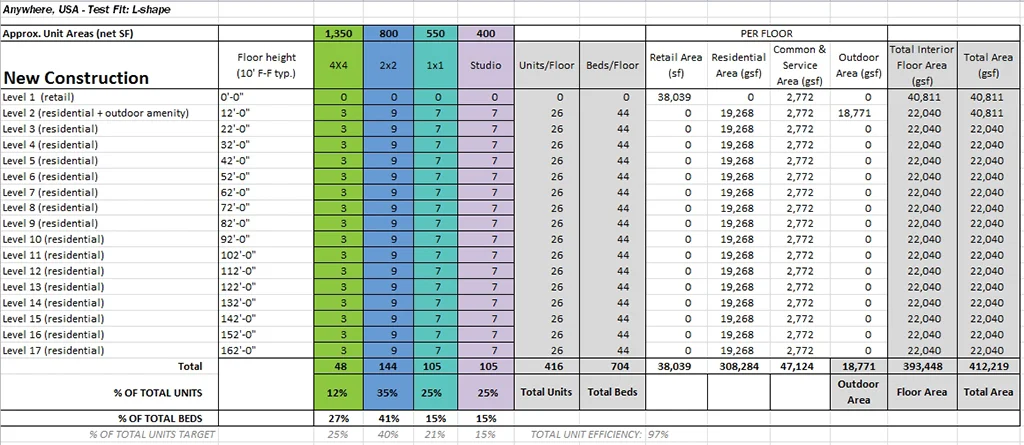
The geometry generated within Dynamo provides an excellent visual representation of early design explorations but ultimately the geometry is only a placeholder for corresponding calculations of area and program mixture. Calculations from the geometry should be set up to not only establish a simultaneous read out within Dynamo but allow for export to other calculation and visualization platforms such as Excel and PowerBI. For our case study, the finalized Dynamo geometry was exported to a blank tab in Excel and queried by a color-coded table of calculations. Based on the fixed Approximate Unit Areas for each residential unit type and desired Percentage of Total Units, the gross residential area extracted from each floor in Dynamo can be divided up to approximate the number of total units of each type and total beds per floor. At the very bottom of the table, the approximated unit mixture can again be compared to the target value to see how much area was omitted during the calculation process -- this example returned a total unit efficiency of 97%, not bad! Remember that this table only represents a preliminary study. As the design goes into Revit for bespoke modeling and when a diversification of unit mixture among floors is desired, a similar strategy between Revit, Dynamo, and Excel can be established to evaluate the precision of those changes.
Raw data populated in Excel from Dynamo also opens up the option for more powerful visual analytics tools like PowerBI. PowerBI is a free tool from Microsoft that allows you develop customized dashboards for any data source. Areas per level, unit mixture, program, FAR, and other feasibility metrics can populate easy-to-read graphics to share with the client and project constituents. If data is captured over time from all the design iterations, charts can be created that illustrate the evolution of the project.

"Hey, this doesn't look like architecture..." You're correct, read about this sample PowerBI dashboard HERE.
An important final step is the seamless transition from feasibility massing to a Revit model. The geometry established in Dynamo can easily be used to begin instantiating generic floor, wall, roof, glazing, and other Revit elements that kick-start the documentation process and eliminate the need for project staff to tediously translate the entire design.
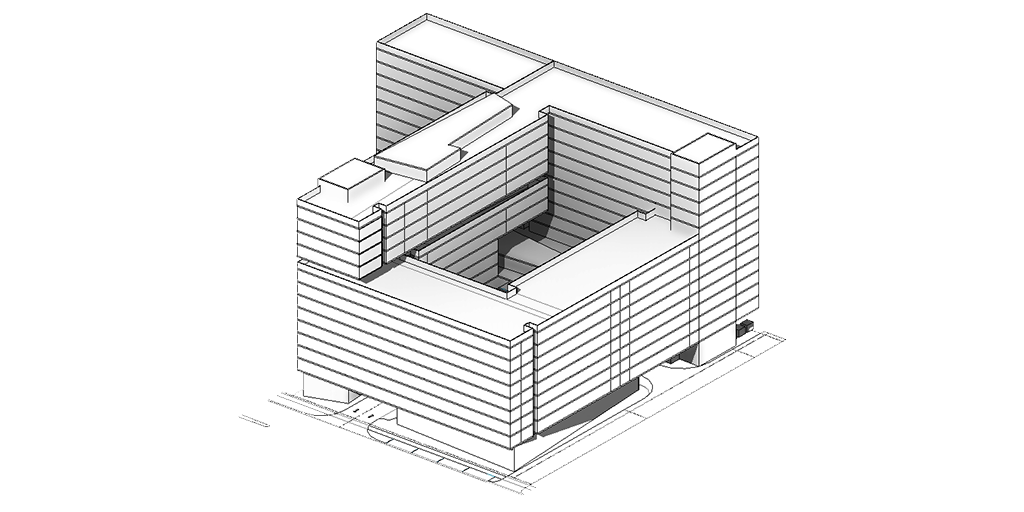
Image courtesy of Shepley Bulfinch.
To wrap up this case study, we decided to also address the use of Dynamo to test out various parking garage configurations. Several months ago I built a definition for evaluating the maximum possible parking spaces that could fit within given site dimensions. The system was designed for a single-helix structure and would adjust the number of parking bays in accordance with minimum code distances for parking spot size, drive aisle width, ramp slope, turn radius, etc. If a required number of spots is established during the feasibility study process for a particular development project, an array of garage layouts and dimension configurations could be fed through Project Fractal to see which combination arrives closest to the target quantity. While this does not necessarily design the entire parking garage automatically, it is an excellent means to rapidly assess dozens or even hundreds of possibilities and validate a particular decision.
So why is all of this research important? Feasibility studies are a perfect example of a regularly repeated process in architecture built on a list of simple variables. Computers and emerging digital tools offer the opportunity to create a formula for rapidly producing a similar outcome. Furthermore, test fits can be altered, iterated, and shared faster than ever before -- buying back time that can be re-invested in delivering more thoughtful and innovative design.
Shout out to Eric Rudisaile for helping me think through the final steps of the vector approach to variable property offsets in Dynamo. Vectors are extremely efficient but their invisibility makes them tricky to troubleshoot, Eric helped me revisit math I hadn't used in a decade!