
With many people working in a Revit model at once, it is challenging to keep the time it takes to sync to Central and navigate between views minimal. A proven way to keep the model performing quickly is to regularly resolve warnings and keep the total number as low as possible. But this is easier said than done; project teams face many barriers when it comes to suppressing the number of Warnings including:
- novice users may be intimidated by the Warnings manager interface
- team members may intentionally avoid the tedium of inspecting issues one-at-a-time
- a solitary BIM manager may not be able to keep up with the rate that the team creates warnings
- unfamiliarity with the entire project may make it difficult for the individuals to make critical decisions
- priority may go to production and deadlines for which the results are more immediately discernible than warning resolution
What if there was a way to make make this process easier and evenly distribute the responsibility among team members?
When working on larger architecture projects in Revit, it is common to assign portions of the building to different team members. Depending on the program, individuals may be responsible for specific areas or entire floors. This means that Dynamo can be used to parse the Warnings export file and assign the elements in conflict to separate users familiar with those levels.
Here is how the Dynamo process works:
- in Revit, go to the Manage tab, click on the Warnings button, and export the file
- open the .html file in Excel, select all cells, unclick the Merge button, and save as .xlsx — the reason for this step is because Warnings where two elements are in conflict occupy two rows but we will eventually only need one of the two elements
- in Dynamo, import the .xlsx file
- use list management to isolate the first of two line items for the Warnings that involve two elements then extract the unique ID number at the end
- using the Revit.ElementByID node from the Rutabaga package or Id to Element node from the Archi-lab/Grimshaw package, actual Revit elements can be selected
- the Element.Level node from the Clockwork package extracts the Revit level that each element lives on. Note that not all elements have an associated level because several Revit Warnings may apply to elements that span the entire project (system families?) like…?
- filter out any elements that do not return a Level and sort the list by Level
- export all of the warnings associated with each individual level to separate sheets in a new Excel spreadsheet using nodes from the Bumblebee package
- point the project team to where the Excel file is saved and they can navigate to the tabs for the levels they are responsible for then isolate the elements that are causing the warning in Revit by copying the ID number from the ELEMENT column in Excel, going to the Manage Tab > Select by ID, pasting the ID, and clicking Show
- it is wise to have the floor plan for that level already open or else it may take several minutes for Revit to automatically open a view to show the element(s) in conflict
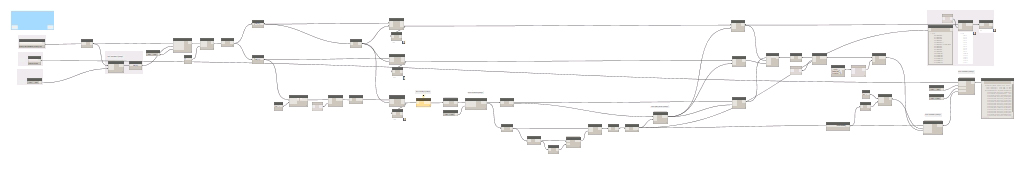
Warnings by Level - Dynamo Definition (hi-res image available HERE)

sample of Excel file export
After browsing through the exported Excel file, some of the floors may not have very many Warnings meaning that it is unnecessary to interrupt the entire team. An advantage of using Dynamo to re-structure all of the warnings according to their associated level in Revit is that the Excel file can also be used to visualize the results with data analytics tools. Using PowerBI, a visual dashboard can be created and quickly updated on-demand with Dynamo to show which levels are accumulating a high number of Warnings then only the team members responsible for those areas need to set aside time for resolution. Another advantage is the ability to keep track of the frequency with which certain levels require model maintenance. If one level is continuously encountering a high number of Warnings, perhaps there is an opportunity for training or a quick refresher on best practices to avoid discrepancies? Maybe allocating more an additional staff member to those levels will help avoid mistakes caused from haste? These are the data stories the begin to reveal themselves through visualization.
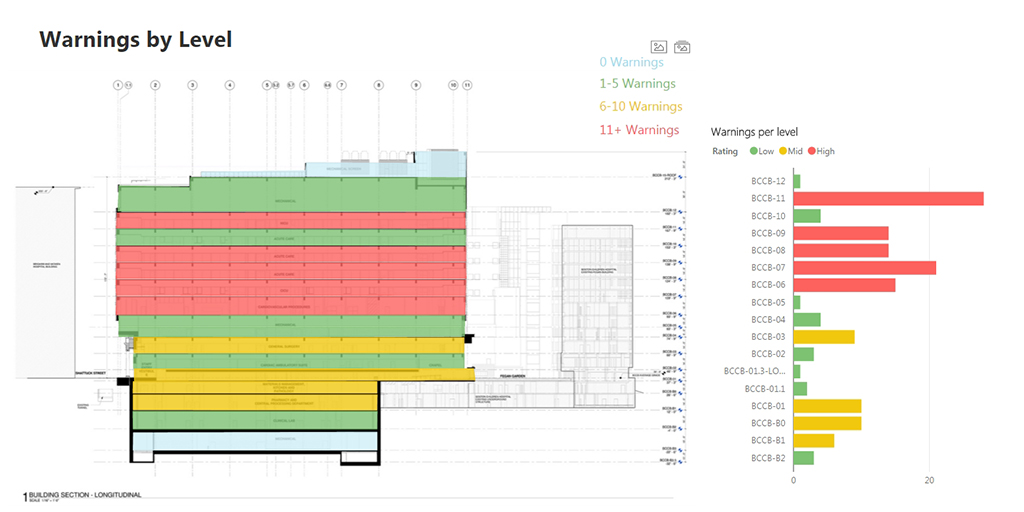
Warnings by Level visualization overlaid on project building section
Specifics on the PowerBI process:
- the first thing you want to do is download Synoptic Panel from the Power BI custom visuals library (https://app.powerbi.com/visuals/
- import the Synoptic Panel into your Power BI dashboard
- Sqlbi has an online tool for generating your own maps (https://synoptic.design/
- it's important to make sure the names match the values in your data exactly or Power BI will not be able to match it
- to apply color blocks to an architectural building section, save the section as an SVG file and drop it into the visual in Power BI
- plug in your data and begin to customize
- lastly you can assign states, compare matched and unmatched, or set a gradient
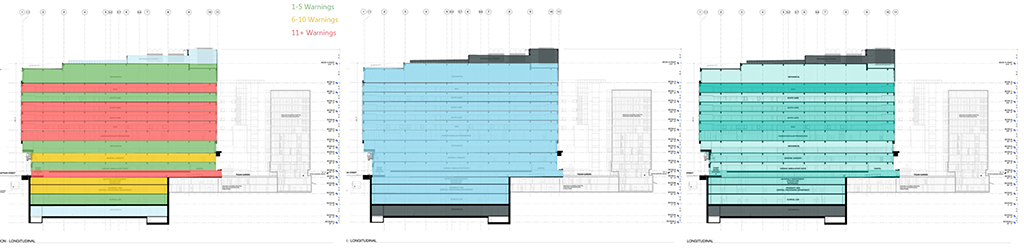
LEFT: States - number of warnings colorized by how much need to be addressed, CENTER: Matched/Unmatched - level contains warnings if blue and does not contain any warnings if white, RIGHT: Gradient - shade of teal varies according to number of warnings
Often there is just not enough time to get to every Warning. Maybe the team or model manager has a limited number of hours to invest into maintenance or a user may have an intermittent hour of free time and ask how they can help. For these scenarios, asking the team to work through the Warnings menu is not an efficient use of time and may also result in element ownership conflicts. Therefore Dynamo can be used to sort the entire list of Warnings according to easiest items to resolve, regardless of which Level they live on. OR after sorting Warnings by Level (see above), each sublist can then be further sorted by the easiest items to resolve. The resulting list can then be exported to Excel and organized or even color-coded from easiest to solve to more time consuming. Some of the easiest Warnings for users of all experience levels to resolve are:
- Elements have duplicate 'Number' values.
- Elements have duplicate 'Mark' values.
- Room is not in a properly enclosed region.
- Multiple Rooms are in the same enclosed region. The correct area and perimeter will be assigned to one Room and the others will display "Redundant Room..."
- There are identical instances in the same place. This will result in double counting in schedules.
- Highlighted walls overlap. One of them may be ignored when Revit finds room boundaries. Use Cut Geometry to embed one wall within the other...
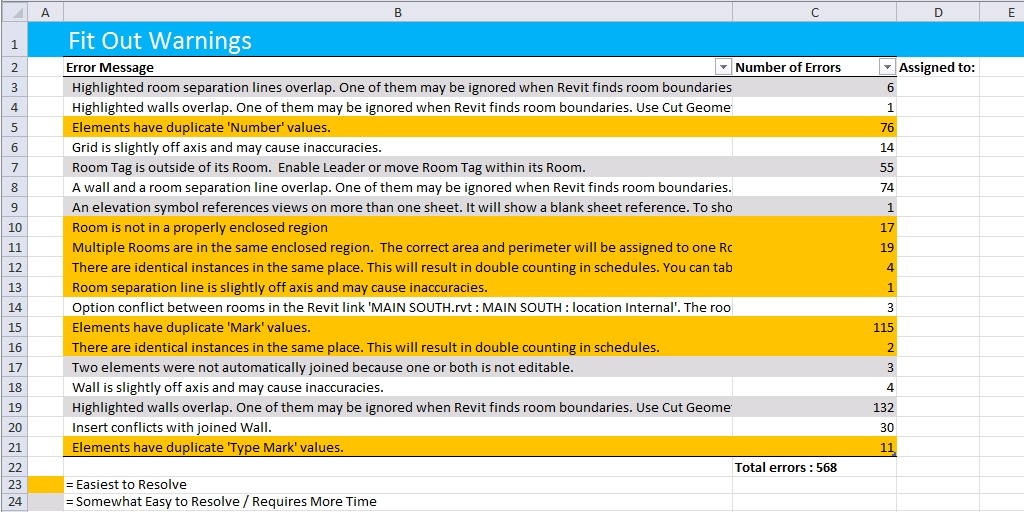
Warnings sorted and colored in Excel pivot table according to easiest to resolve
All of these workflows demonstrate how increased familiarity with Dynamo leads to re-thinking traditional Revit approaches and discovering new ideas for efficient production. No longer are we trapped within the confines of the default Warnings manager but tools like Dynamo, PowerBI, and others allow for immediate and seamless Revit analytics. Most importantly, these tools can be distributed at scale across all BIM projects in the office and help empower users of varying experience levels to improve model management efforts, which ultimately results in increased Revit performance and significant time savings.
This post was produced in collaboration with Jessica Purcell