
This winter I joined an adult ski racing league and got back into the sport for the first time in over a decade. Each week racer performance is entered into a complex scoring rubric that determines overall team standings. After seven weeks of racing, this rich dataset was too tempting for a data visualization enthusiast like myself to pass up.
How the scoring works:
- Each team consists of four members, they can be any combination of males and females.
- Races occur once a week and two courses are set side-by-side, one red and one blue.
- Every racer gets two runs per race, once on each course.
- The racers are ranked according to previous week performance and are paired up by number, this means that you are racing an opponent on every run.
- 2 Points are awarded if you earn a faster time than your opponent on each run. If your opponent does not show up to race that night and you succesfully finish your run, you receive an easy Win.
- 2 Points are awarded if your time on a particular course is faster than the time you earned on that course (red or blue) the previous week.
- Up to 4 Points are available if you earn a time within a given handicap time range. The breakdown of these times is as follows:

How the adjusted handicap time is calculated:
- Every week, one or two pacesetters will ski the course before all the racers. Their times are divided by their individual nationally-certified handicap percentages to determine the best possible time on that particular course.
- The fastest of the two pacesetter times is then multiplied against all of the other racers’ times to determine each person’s adjusted handicap time.
[To become certified, they attend a Regional Pacesetting Trials event where their top times are compared directly to those of US Olympian, Ted Ligety. To learn more about pacesetting, CLICK HERE.]
Back to scoring:
- Each week racers can earn up to 12 Points for their team.
- The top three highest scores from each team are taken and added to the team’s overall total.
- At the end of seven weeks, the top 5 teams from each night of the week (Monday-Thursday) are qualified to compete in one final championship race. The highest scoring team wins.
At first the results were posted as paper print-outs which resulted in a few hours of manual data entry to build the initial database. After establishing a database, complex calculations were required to reverse engineer the scoring system and then emulate the score keeping based on each racer’s weekly results. Once again I turned to Dynamo’s visual programming capabilities to build a tool that could process all of the information.

Eventually the Nashoba ATR staff began posting the results to their website on a weekly basis which eliminated the need for both data entry and using Dynamo to compute all of the adjusted times and scoring. I could then quickly scrape the latest data each week and dump it into an excel spreadsheet where specific metrics were calculated. After using the handy data reshaper add-in for Excel, each spreadsheet was pivoted and then imported in Tableau for visualization. Now the performance of teammates against the rest of the league could be easily understood graphically:

As well as overall league standings:

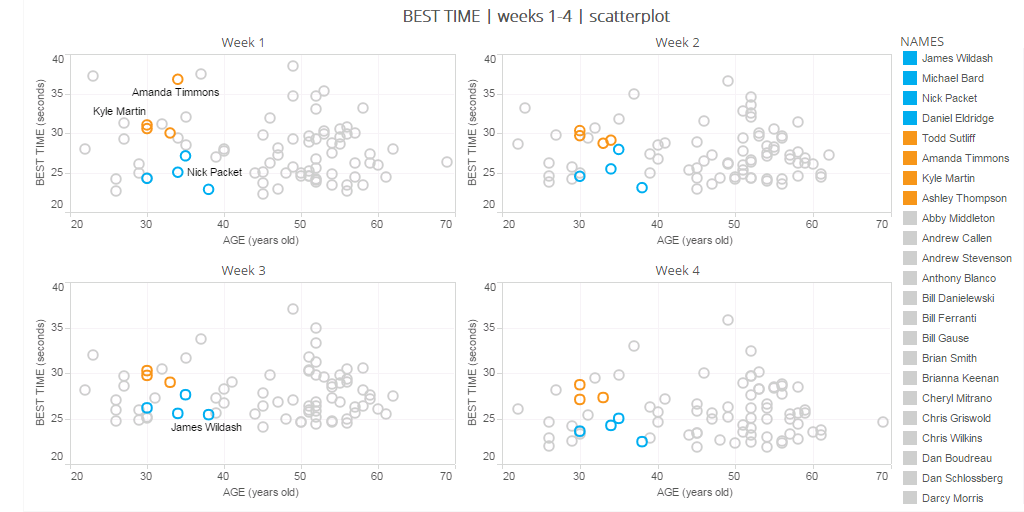
The complexity of the scoring system made for a relatively fair, enjoyable, and competitive experience regardless of age or gender. It also created some very interesting visualizations such as the breakdown of scoring by age and gender for the first four weeks:
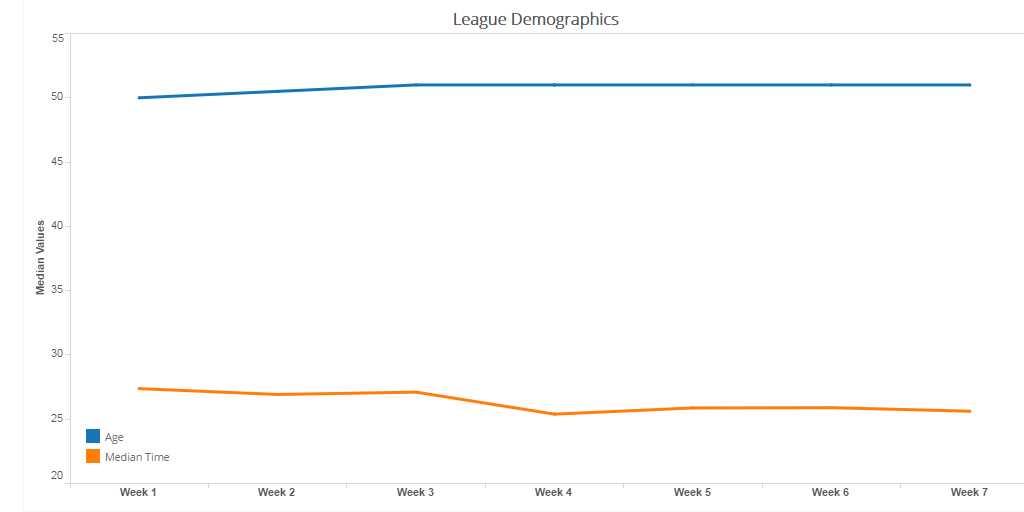
And the median age and time per race:
[Notice how the more “experienced” racers generally smoked the rest of the field.]
Ultimately the data helped me quickly understand the league and identify the nuances in scoring that could help improve my performance. It felt to get back out in the course after so many years, I cannot wait to do it again next season!

Shout out to my teammates and special thanks to Nashoba Valley Ski Area for generously posting results online and weekly updates. The original dataset can be viewed HERE.