Design Technology Throwdown 2017

Last Spring during the process of work-shopping ideas for the beyondAEC Hackathon, the concept for an office-against-office design technology competition emerged. Coincidentally the 2017 Greenbuild International Conference and Expo collocated with the Architecture Boston eXpo (ABX) -- an annual AEC industry conference hosted by the Boston Society of Architects (BSA). What a perfect venue for exhibiting expertise in the Greater Boston community through a live competition on full display of the public! After connecting with Billy Craig from the BSA and Karen Young from Informa, both organizers absolutely loved the idea and set out to bring it to life.

ABX17_DesignTechThrowdown_logo.jpg

The Design Technology Throwdown was born and the rules were simple:

DTT is a first-of-its kind competition where teams will face off to see who can design the best solution to a mutual design problem. A champion will be crowned for the best use of contemporary technology to develop, document, and validate their design. In concordance with Greenbuild's mission of sustainability, extra consideration will be given to projects that incorporate environmental analysis and sustainable design strategies. So assemble a team of 4 to represent your organization and register to throw down against Boston's best!

A panel of expert judges was procured:

Headshot_Nirva Fereshetian.jpg

Nirva Fereshetian
Chief Information Officer
CBT Architects

Headshot_Jordan Goldman.jpg

Jordan Goldman
Engineering Principal
ZeroEnergy Design

Headshot_Michael Kyes.jpg

Michael Kyes
Architectural Team Leader
SMMA

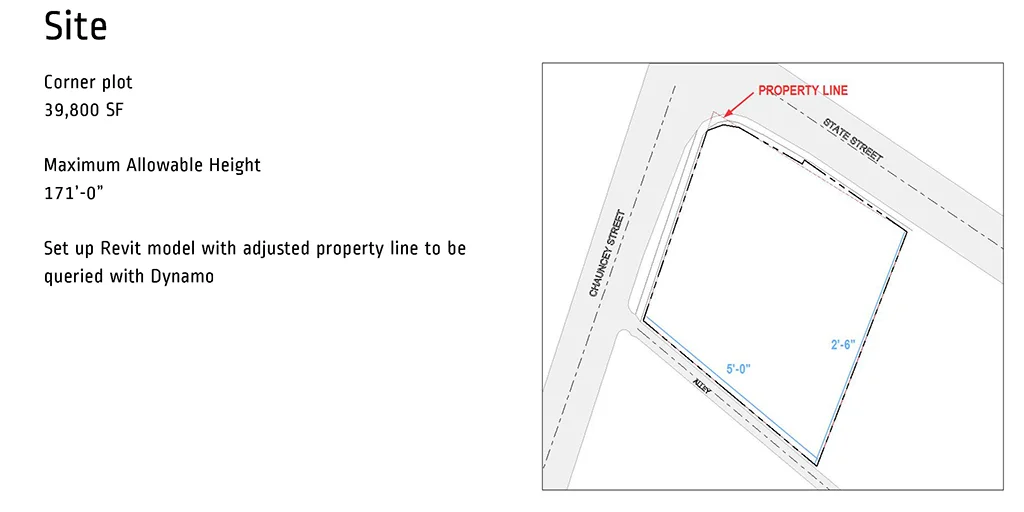
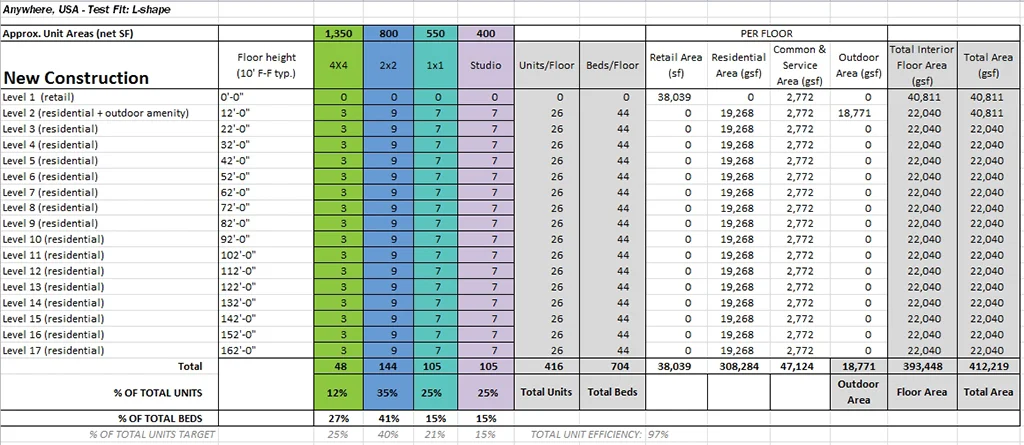
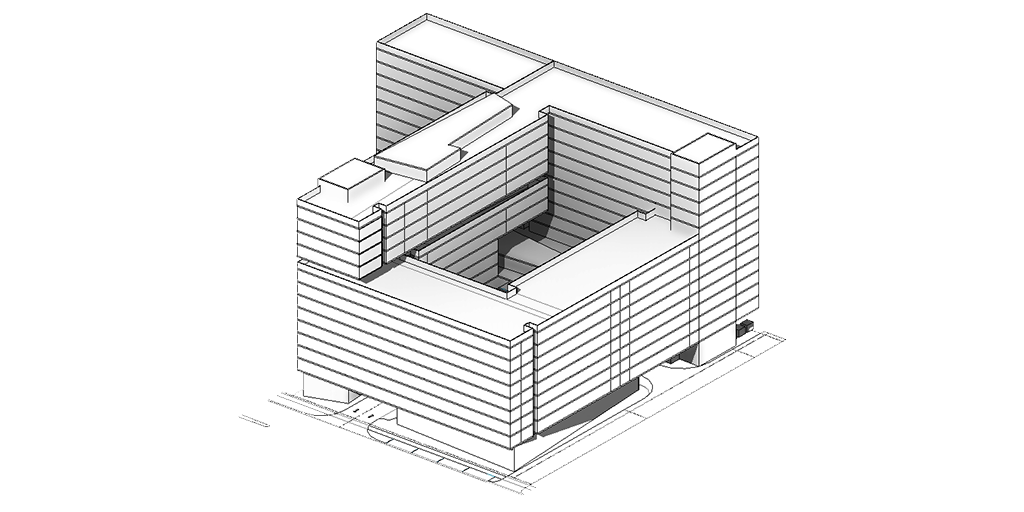
Four brave teams registered to answer the challenge and 24 hours before the start of the event, a design brief outlining all the particulars of the site was distributed.
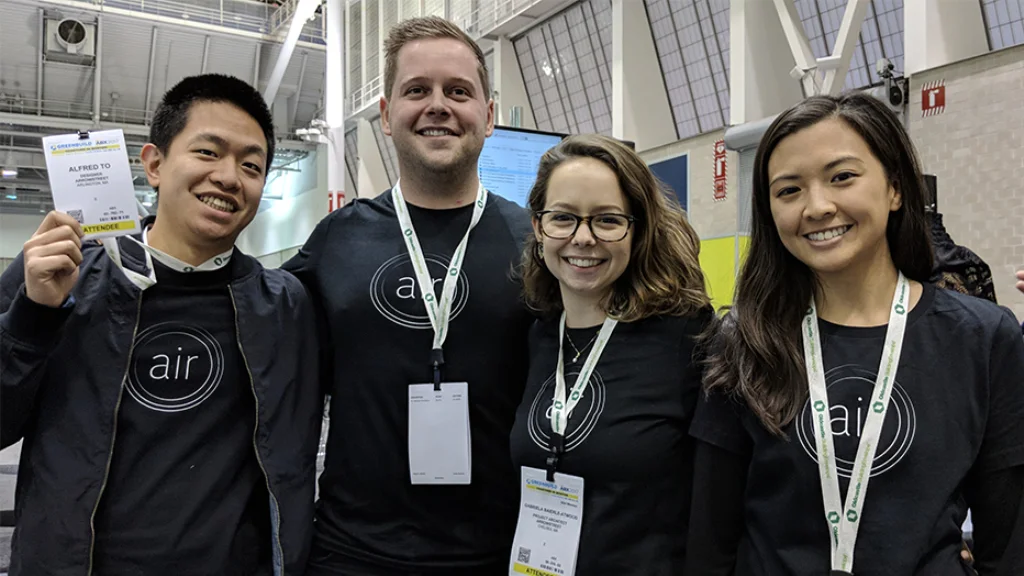
Arrowstreet

Edbert Cheng, Gaby Baierle-Atwood,
Katherine Chin, Tristan McGuire

DTT_team photo_CBT Architects.jpg

CBT Architects

Rood Vincent, Lynn Quagliato,
Anthony Polidoro, Marwan Ghabour

DTT_team photo_Elkus Manfredi.jpg

Elkus Manfredi Architects

May Dussadeevutikul, Alex Nunes,
Nensi Karanxha, Sherry Li

DTT_team photo_Microdesk.jpg

Microdesk

Eric Rudisaile, Jackie Doak,
Angela Doyle, Mike McGovern

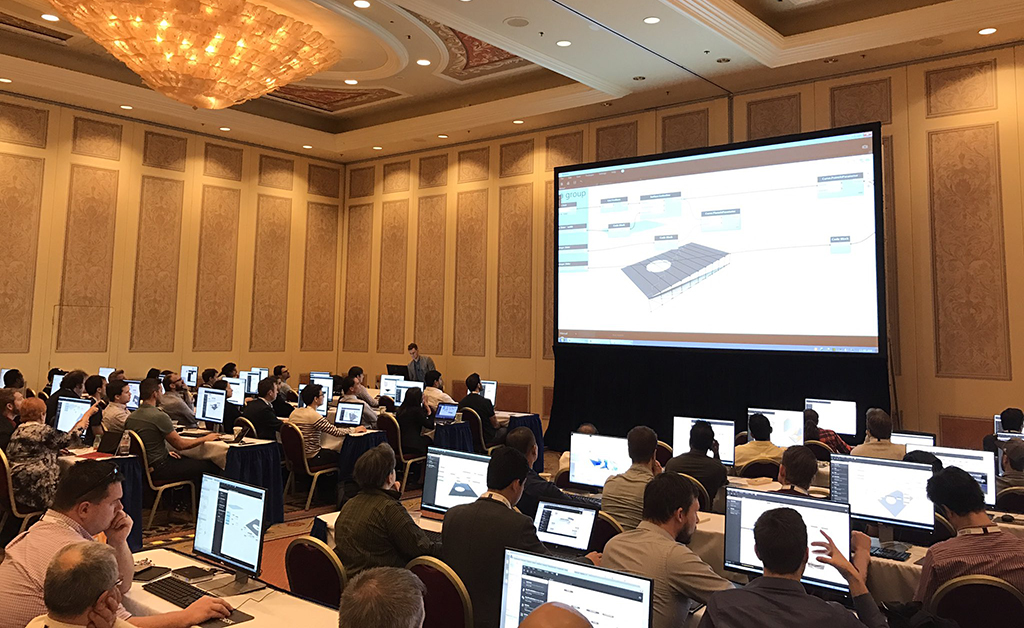
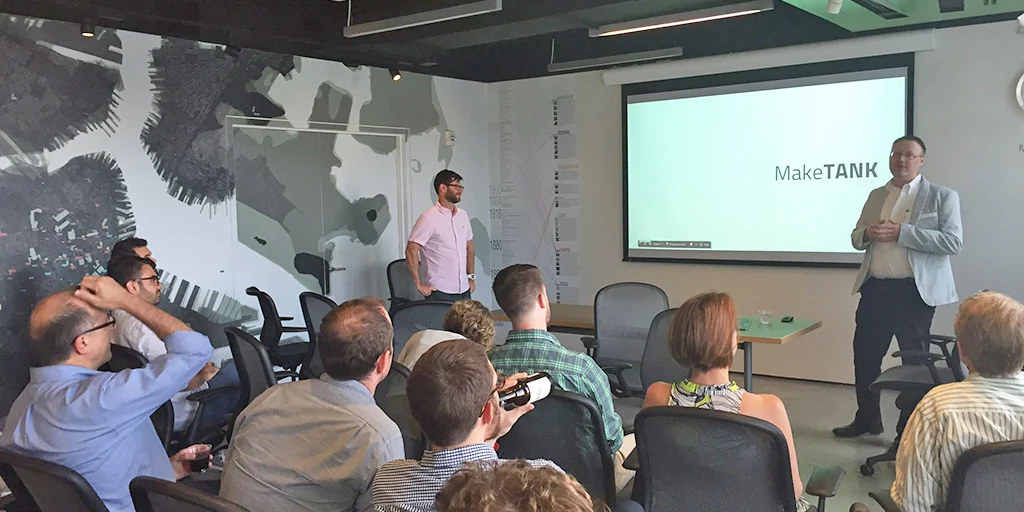
On Thursday, November 9th the competition kicked off with a 4 hour production period. Each team got right down to business developing their collective responses to the site.

DTT_groups working 1.jpg

Following the production portion, each team had 5 minutes to present their designs with judges asking clarifying questions after every pitch. Watch the entire recap and thumb through the accompanying slide decks for each team:

After every team had presented, the judges deliberated and one winner was chosen -- Arrowstreet!

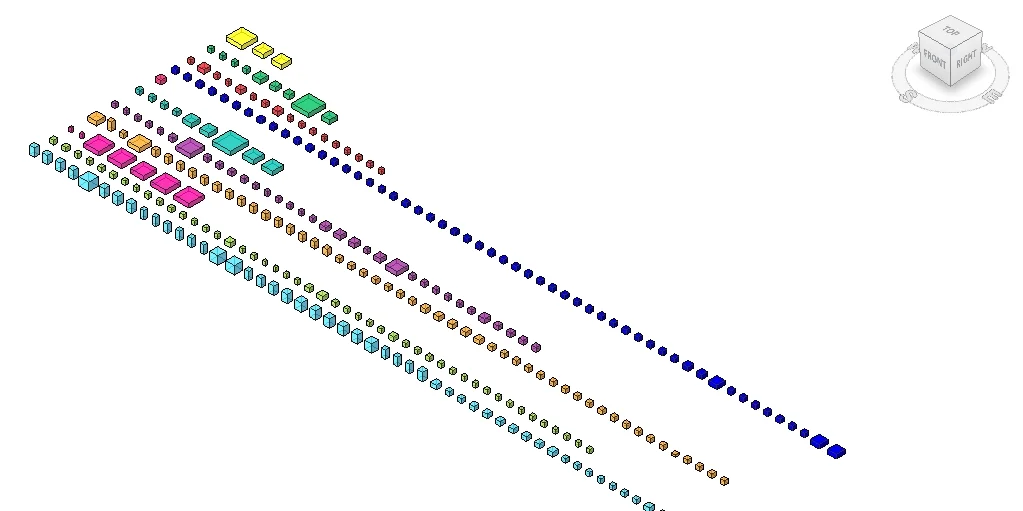
"[The winning project]... was called Place to Grow, a proposed live+work building with tiers for urban farming, allowing residents to grow their food and have a farm-to-table market and public space on the ground level."
-- Gabriela Baierle-Atwood, AIA, Arrowstreet

Brad Prestbo (DTT organizer), Edbert Cheng, Gaby Baierle-Atwood, Katherine Chin, Tristan McGuire, Kyle Martin (DTT organizer)

Brad Prestbo (DTT organizer), Edbert Cheng, Gaby Baierle-Atwood, Katherine Chin, Tristan McGuire, Kyle Martin (DTT organizer)

Reflecting on the Design Technology Throwdown, it was a pleasure to watch the different ways that both individuals and offices work. Equally as fascinating as the contrast of workflows and approaches across offices, there were numerous similarities amongst the design ideas, tools, and various skillsets of the participants. I truly enjoyed seeing the local community come together, recognize, and celebrate the amazing surge in design technology that is currently taking place in the AEC industry. As a persistent evangelist of evolving digital tools, I am inspired to continue to organize events like the Design Technology Throwdown to further encourage knowledge sharing, embrace common expertise, and elevate the future of the industry in solidarity.

Several weeks following Greenbuild/ABX 2017, the trophy arrived in the mail and was presented to Arrowstreet.

Photo credit: Sara Garber, Arrowstreet

Photo credit: Sara Garber, Arrowstreet

A huge thanks goes out to the Informa team -- Karen Young, Shelby Snelson, and Anna Lehman -- as well as Billy Craig from the Boston Society of Architects, without their support this event would not have happened. I also would like to thank my co-organizer Brad Prestbo (Sasaki), and expertise volunteers Peter Atwood (design technology educator) and Daniel Fink (MIT/Placeful.io). We appreciate all three distinguished judges who volunteered their valuable time to provide insightful criticism and perform the challenging task of picking a winner. Lastly, thank you to the hard-working participants and congratulations to the Arrowstreet team!

Dynamo-litia Boston - September 2017

For this month's installment of the Dynamo-litia, we celebrated the 2 YEAR ANNIVERSARY of the user group's existence!

Dynamolitia_2yr-anniversary_FINAL.gif

plus...

Dynamo-litia_Meeting 12_marketing_FINAL.jpg

Comparing Computational Approaches / Dynamo-litia Turns 2!
The AEC industry is currently experiencing a surge in technology with new tools emerging every day to produce time-honored deliverables in unique ways. What has long been considered "industry standard" software is being aided and at times replaced by the "right tool for the job".

Please join Ilaria Giardiello Assoc. AIA and Kyle Martin Assoc. AIA as they lead a live demonstration of the spectrum of computational approaches that can be used to accomplish the same task, including: Dynamo, Custom Nodes, Design Script Syntax, and Python. Today there are many ways to get to the same end result; this session seeks to illuminate why it is important to be aware of the tools at your disposable and play to your strengths.

Also this month is the 2 Year Anniversary of the Dynamo-litia Boston user group! To celebrate we will be recapping the past year as well as highlighting a flurry of events happening this Fall. This is one session you won't want to miss.


When: September 27, 2017
Where: BSA Space - Boston

More information at the Boston Society of Architects .
Presentation slides and datasets can be downloaded HERE .

beyondAEC Hackathon 2017

The inaugural beyondAEC hackathon for the Greater Boston architecture, engineering, construction, and real estate development community was held on September 15-16, 2017. The competition consisted of a 24-hour window where teams of up to five could create never-before-seen technological solutions to challenges faced in the industry.

beyondAEC_logo.jpg

Held at Sasaki Associates in Watertown, the event was an overwhelming success with 43 registrants dividing into 10 project teams that consisted of: 7 college students (AEC and computer science), more than 25% women, and 21 different companies representing architecture, landscape architecture, construction, mechanical and structural engineering, technology and architecture consulting, computer science, software, and fabrication. In the end three projects were chosen for Most Impressive Use of Technology, Most Practical (could be used in an office "tomorrow"), and Best Cross-discipline Hack among teammates.

For a full recap of the event, winners, and photos head over to the beyondAEC.tech website.

MY SIDE OF THE STORY...

As one of the principal organizers of beyondAEC, my vision was to help propel the profession into the future by providing a forum where people could demonstrate technological expertise, learn new skills, and create something innovative through teamwork and collective resources. Teams naturally formed at the outset and the excitement and passion was palpable throughout as each worked diligently towards their ultimate deliverable. When the dust settled, I was blown away by the quality of the projects created and the sense of achievement -- I could not have asked for better turn out and participation. The hackathon provided a unique bonding activity across disciplines, experience levels, and offices to a level unlike any I have never seen in the Boston AEC space.

beyondAEC_KM announcements.jpg

We hope to make this an annual event and highly encourage participants from areas outside of Boston to join us as well. For future announcements, make sure to follow the beyondAEC Twitter account OR if you are interested in getting involved in the 2018 hackathon please supply your information through this form.

beyondAEC_post hack drinks.jpg

I cannot thank my team of collaborators enough for their persistent dedication and contributions -- Brad Prestbo, Jim Martin, Andrew Brown, Reilly Zlab, and Sebastian Ebarb. Thank you to our sponsors for taking the risk on this first event and helping bring it to life through their generous donations. Lastly, shout out to Jonatan Schumacher, Rob Otani, and Shannon McMullan from Thornton Tomasetti CORE Studio who put on one of the BEST hackathons year-after-year for the advice and inspiration.

DynamoDC - Precision Inquisition

Last week I had the pleasure of presenting [remotely] to the DynamoDC user group. Timon Hazell reached out to ask if I would be willing, and since he had so generously served as our guest lecture for the Dynamo-litia September 2016 meeting, I was more than happy to return the favor. Apparently DynamoDC has previously hosted several intro to Dynamo workshops so he asked if I could demonstrate a more advanced example of how Dynamo can be used to extend Revit functionality.

One of my favorite things about AEC community outreach through user groups, conferences, and hackathons are that I am exposed really interesting problems that I would not have encountered in my own work. At the beyondAEC Hackathon the week before, one of the participants had asked me if there was a way to use Dynamo to isolate the exterior facade material areas and types specifically corresponding to a room in the building. I figured DynamoDC would be the perfect opportunity to tackle this workflow and the PRECISION INQUISITION: Advanced Extraction of Revit Model Information Using Dynamo presentation was born...

Image 1_DynamoDC_precision inquisition.jpg

Revit models are powerful repositories of geometric, numeric, and descriptive building information, however the default tools for accessing that information are often limited and cumbersome. Recent questions have been raised about utilizing Dynamo to execute precise tasks such as performing quantity takeoffs on specific portions of an exterior facade, comparing vision glass to room area, or even evaluating the proportion of total facade area by building orientation. Special guest Kyle Martin will deliver a [remote] live demonstration of advanced model analysis approaches with Dynamo. Topics covered will include: visual programming principles, general logic, list management, list at level, filtering and sorting, index tracking, querying Revit parameters, geometric properties, color for clarity, and much more.

In the hour of available presentation time I hoped to cover the following ambitious list of concepts:

  • basic visual programming principles
  • general logic
  • list management
  • list at level
  • filtering and sorting
  • index tracking
  • querying Revit parameters
  • geometric properties
  • color for clarity

As I prepared for the presentation, the Dynamo workflow grew increasingly complex.

The principal function of the Dynamo definition was to query exterior wall geometry from the model based on a room number and perform material takeoffs, directional composition, and visual analysis.

OBJECTIVES: Target specific rooms in the Revit model by Room Number, isolate the exterior Wall/Window elements specific to that room, calculate total area of exterior facade for each Room, understand composition of vision to solid materials, and ass…

OBJECTIVES: Target specific rooms in the Revit model by Room Number, isolate the exterior Wall/Window elements specific to that room, calculate total area of exterior facade for each Room, understand composition of vision to solid materials, and assist with code calculations such as light & ventilation.

OBJECTIVES: Query all exterior Wall elements, use the underlying geometry to determine direction of each wall, sort walls by cardinal directions or bespoke orientation system, and calculate proportion of facade areas for each direction.

OBJECTIVES: Query all exterior Wall elements, use the underlying geometry to determine direction of each wall, sort walls by cardinal directions or bespoke orientation system, and calculate proportion of facade areas for each direction.

OBJECTIVE: Color specific items for analysis, visual clarity, and storytelling

OBJECTIVE: Color specific items for analysis, visual clarity, and storytelling

The live demonstration was recorded for your viewing pleasure. You may notice the video starts a little late due to technical difficulties but no significant content was missed. Presentation slides and the Dynamo file can be accessed HERE.

Even with a rush towards the end, I was able to successfully make it through all the content. I appreciate the audience being super receptive and patient given the hands-off format. And a very special thank you Timon Hazell, John Schippers, and Dana De Fillippi for the opportunity.

DynamoDC audience

DynamoDC audience

Kyle's "home studio" setup

Kyle's "home studio" setup

The other day I received a surprise t-shirt in the mail as a thank-you, I will wear it with pride!

Image 5_DynamoDC t-shirt.jpg

Journey to the West Coast - ACBD2017 & SFDUG

Last week I was in San Francisco for the inaugural Advancing Computational Building Design conference featuring two days of speakers, panels, and discussions centered around the growing importance of technology in architecture, engineering, and construction. The conference placed a particular emphasis on computational design -- the use of coding, visual programming, data analytics, and other methods for more informed design and implementation.

I had the pleasure of speaking on a panel titled "Reimagining the Culture & Contractual Relationships Between Owners, Architects, & Contractors to Enable Further Adoption of Computational Design" alongside Aubrey Tucker, Innovative Technology Developer at Stantec and Thomas Whisker, VDC Project Manager at Turner Construction. While my colleagues focused on the intricacies of contracts, BIM disclaimers, and model fidelity, I took the opportunity to share how Tocci Building Co. is approaching projects differently. As Owner's Project Manager on several projects, we have the unique authority to bring the Virtual Design and Construction (VDC) team in earlier on the project for design facilitation and a simultaneous quantity takeoff and pricing process. At Tocci, computational design further enhances what we are able to do.

Panel from left to right: Kyle Martin, Aubrey Tucker, Thomas Whisker. Moderator: Jorge Barrero. Photo credit: Ryan Cameron.

Panel from left to right: Kyle Martin, Aubrey Tucker, Thomas Whisker. Moderator: Jorge Barrero. Photo credit: Ryan Cameron.

With more traditional project delivery VDC implements vigorous MEP/FP coordination, resulting in confirming RFIs for near-instantaneous response time and less tedious paperwork. A major advantage in a collaborative approach to project delivery/coordination is that potential conflicts are identified earlier in the project. Resolving issues before they are time sensitive and at a time when the owner can stll make decisions about the cost of the project -- rather than have those decisions made for them by construction schedule -- will ultimately deliver a final product much more closer to the initial design intent.

The key takeaway from ACBD for me was the overwhelming consensus that technology is crucial to the future success of the AEC industry. I attend several conferences per year and never have I encountered a more unified, passionate crowd of interdisciplinary professionals who are consistently pushing the boundaries of possibility and setting an example of true innovation through their work.


SFDUG_8-2017_Cost inTranslation.jpg

Later that evening I delivered one of two featured presentations to the San Francisco Dynamo User Group celebrating their 2-year Anniversary at AIA San Francisco. The SFDUG was formed with the same purpose as the Dynamo-litia Boston User Group I founded at the Boston Society of Architects to help educate and promote the use of Dynamo visual programming in local AEC communities. My presentation "Cost in Translation: Bridging the Gap Between Designers & Contractors" highlighted some of my efforts at Tocci including several day-to-day implementations of Dynamo and longer term projects such as the Sasaki WinterLight Pavilion and Union Point Comfort Station. The crowd at this event was super receptive and it was fun to meet so many new faces from the opposite side of the country!

Image credit: Ryan Cameron

Image credit: Ryan Cameron

Unfortunately there was an error recording my portion of the presentation, however you can view the slide deck HERE.

Make sure to check out the other presentation Computational Design Increases Value to Project Managers & Designers | How to gain Buy-In by colleague Ryan Cameron, Architect at DLR Group.

In the end it was a busy couple of days on the West Coast but I thoroughly enjoyed the opportunity to exchange knowledge and promote the importance of computational design and data-driven processes in the future of the AEC industry.

BSA Profile - Kyle Martin, Associate AIA

I am honored to have recently been featured in a profile piece on the Boston Society of Architects website!

Where is the field of architecture headed?
Over the last few years I have worked to promote the use of design technology in the architecture profession. Our industry trends toward outdated traditional approaches over emerging technology. Post-analysis is a waste of time if it does not inform future projects. I have seen architecture firms of all sizes and practice areas habitually reinvent the wheel on projects. We stand on the precipice of a new era, and I have made it my personal crusade to help designers everywhere understand that data-driven and computational approaches can drastically improve the efficiency and efficacy of practice.

What do you hope to contribute from your work?
I spend a considerable amount of time blogging, tweeting, teaching, leading Dynamo-litia, and presenting at conferences—all in an attempt to satisfy curiosity and contribute knowledge to the community at large. Much of the time I’ve invested has been spent trying to increase my own familiarity with various software platforms to tackle complex design challenges and implement task automation for redundant BIM workflows. In my new construction role, I am encouraged to develop tools to improve design translation, cost engineering, and process optimization. I am no longer tasked with convincing my colleagues of the benefits of the technology, as much as I am with developing and implementing new technological methods and tactics. I am quickly realizing the lessons I have learned from extracurricular exploration have equipped me with skills to address obstacles that have arisen in practice.

Head over to the BSA website to read the full profile.

Hands-on Prototyping for BUILDing Forward

Read about the unique opportunity for geometry analysis, fabrication, and the resulting gallery installation as initially reported on the Tocci Blog...

Image Credit: Jamie Farrell

Image Credit: Jamie Farrell

On July 27th, an opening reception was held for Autodesk’s BUILDing Forward exhibit at the Boston Society of Architects. This exhibit celebrates digital craft in the greater Boston community and highlights the research projects made possible by the Autodesk BUILDSpace — a state-of-the-art research and development facility in the Design Center.

Tocci partnered with Sasaki Associates to research and develop a prototype called WinterLight, a proposal for a temporary winter pavilion for the Rose Kennedy Greenway. Currently in the early design phase, WinterLight is a warming hut designed to encourage activation of the city’s public realm during the winter months. The structure is a semi-dome with strategic openings in customized masonry blocks, designed to shield visitors from winter winds while they enjoy the warmth of an interior fire pit. The final location of the pavilion will be located in Boston: the site is to be determined.

Image Credit: Lucca Townsend, Sasaki Associates

Image Credit: Lucca Townsend, Sasaki Associates

This project required extensive computational design from Sasaki staff to strike a balance between desired aesthetic and regularity of the blocks. Tocci’s role was to assist with geometry analysis and support the design process through construction feasibility studies. With each new design iteration, we utilized Dynamo Studio to extract total pavilion dimensions, overall block quantities, block sizes, repeatable types, total volume, total weight, and other metrics.

Image Credit: Lucca Townsend, Sasaki Associates

Image Credit: Lucca Townsend, Sasaki Associates

image 2b - color analysis & block types.jpg

The BUILDing Forward exhibit provided the perfect opportunity to experiment with fabrication methods and materials for producing the unique geometry of the blocks. Sasaki chose a section of nine blocks comprised of five unique types from the overall pavilion to demonstrate scale and geometric variation. They first generated a digital model of the composition, and then processed the individual shapes into toolpaths for cutting profiles from Medium Density Fiberboard (MDF) using a Computer Numeric Control (CNC) three-axis router. They continued to cut an ingenious system of holes into the MDF sheets, lining up each piece using threaded rod. This created a negative form of each block shape for pouring concrete. Each concrete form also incorporated removable sections and a hole at the top for concrete. At this time, they sanded and coated the interior surfaces of the forms with an epoxy sealer to facilitate the release of concrete.

image 3 - molds disassembled.jpg

To prep for pouring, we disassembled the forms to coat the interior surfaces with form release. They were then reassembled on the threaded rod guides and tightened using nuts and washers.

image 4 - molds coated.jpg

We blended Portland cement and sand silica to create a concrete mixture that could support the compressed weight of the stacked blocks and maintain a smooth, gallery-quality finish. As each five-gallon-bucketful of concrete was poured through the top, a team tapped the sides of the forms, agitating the mixture and forcing trapped air bubbles to the surface.

Image Credit: Christine Dunn, Sasaki Associates

Image Credit: Christine Dunn, Sasaki Associates

At times, the form release did not properly work, forcing us to pry the blocks from their forms.

image 6 - block releasing.jpg

Rotating shifts of the Sasaki-Tocci team spent a week to producing the prototype, as each block required 24 hours to cure. With one last round of chiseling and sanding, all nine blocks were ready for their BSA Space debut.

image 7 - blocks stacked.jpg

The opening reception was well attended. It was inspiring to see so many creative projects coming out of the BUILDSpace and local AEC community. BUILDing Forward will be on display at the BSA until October 5th, 2017 if you would like to see our work and all the other excellent projects.

Stay tuned for more as the WinterLight project evolves into a full-scale realization.

Check out this Sasaki blog post about the BUILDing Forward event for even more information.

Dynamo-litia Boston - June 2017

Improving Processes, Increasing Efficiency + A Fish Out of Water

This special installment of Dynamo-litia Boston featured presentations from Luis Useche, Anne Loiselle, and Jason Detwiler about their work at SMMA and experiences using Dynamo in practice.

Improving Processes, Increasing Efficiency:
We will be presenting the progression of identifying a current manual process to developing a dynamo solution. In this case our example is the manual process of calculating the window-to-wall ratio for building envelopes. We will look at the existing processes teams are using, how we developed the script, and how we see it being implemented and improved going forward.

A Fish Out of Water -- Teaching Digital Fabrication at Autodesk BUILD Space via the BAC:
Jason will be sharing his experience to date teaching Digital Fabrication for the Boston Architectural College at the Autodesk BUILD Space, which may or may not contain some dynamo explorations. The Studio itself is studying Light as Material, using digital fabrication tools.

When: June 29, 2017
Where: SMMA - Cambridge

More information at the Boston Society of Architects.
Presentation slides and datasets can be downloaded HERE.

Facades+ Boston - Visual Programming with Dynamo Workshop

Originally featured on the Tocci Blog, I recap my recent experience co-leading a Dynamo workshop at this year's Facades+ one-day conference in Boston...

Last week I attended and presented at this year’s Facades+ Boston event — a one-day symposium and trade show focused on the importance of high performance envelope design in the AEC Industry.

SYMPOSIUM:

The first half of the day featured three engaging panel discussions.

Panel 1 – Expanding the Envelope: Generating Urban Data for Responsive Design:
This group of panelists urged the importance of data, tech innovation, and digital equity in the Boston built environment. Capturing data for many city metrics helps reveal trends and provide insight for a prosperous and safer tomorrow.

Panel 2 – Modernist Performance Retrofits:
One presentation in architectural detailing for a historical retrofit project provided an intriguing contrast against a second presentation about examining materials and fenestration details to identify high-performing wall assemblies at different price-points. While one project carefully considered the aesthetic ramifications of their intervention, the other team thoroughly emphasized performance.

Panel 3 – Making Space for Bostonians:

Place-making is an essential consideration in urban design and these three panelists discussed the role that strategic programming, structural and material innovation, and inviting public space has played in creating thriving districts in the city of Boston.

VISUAL PROGRAMMING WITH DYNAMO WORKSHOP:

Colin McCrone and I led an afternoon workshop that demonstrated the usefulness of visual programming for Revit in facade design and analysis workflows. Our workshop kicked off with an introduction to the concepts of computational design, migration across various software platforms, and examples of how the tools are being used in the industry today.

After providing an overview of the interface, terminology, functions, and features, the first exercise tackled one of Revit’s most temperamental elements – curtain wall. Modifying curtain wall requires many sequential clicks to adjust overall size, mullion spacing, and exchanging pinned panels, mullions, and doors. Dynamo provides the capability to query information from the model, target specific items, and batch alter them as needed. The accompaniment of math and logic adds further analysis and opportunities for customization to the process.

TBC blog_KM Facades+_1.jpg

For the final portion of the workshop, we highlighted three panelization processes that demonstrate the geometric design potential of Dynamo. The first used pixel brightness from an image to swap out panels by color and generate a mosaic interpretation.

The second read point coordinate data from an excel spreadsheet to place 4-point adaptive curtain wall panels in a curvilinear wall configuration.

TBC blog_KM Facades+_3.jpg

Lastly, the third utilized the Revit Sun Path tool to analyze solar gain on each panel of a wall surface and colorize the panels from least to most exposure.

TBC blog_KM Facades+_4.jpg

Overall the experience was a huge success and we both thoroughly enjoyed sharing our knowledge with the 20 or so members of the Boston AEC community who attended our workshop.

If you would like to learn more about Dynamo, the June gathering of the Dynamo-litia Boston user group will feature a brief recap of the Facades+ workshop and more in-depth presentations of how Dynamo is being used in practice.

More about Facades+ Boston

Dynamo-litia Boston - April 2017

This action-packed meeting featured...

1. Regular Dynamo-litia Boston meeting

  • current events from the Dynamo-litia Boston community
  • introducing Ilaria Giardiello from Sasaki as the new co-chair!
  • a presentation by Eric Boehlke: panelization workflow and analysis using Dynamo, Dynamo web Customizer, Project Fractal, FormIt, .csv, and Excel

2. Dynamo Block Party
Kyle Martin - Tocci Building Companies | Dynamo-litia - Boston, MA:

  • about Dynamo-litia Boston
  • Dynamo tools for interpreting & translating design intent
  • early collaboration amongst project constituents

Ryan Cameron - DLR Group | DesMoinamo - Des Moines, IA:
Block Party Announcement

  • took the opportunity to share a workflow he is currently working on & ask questions from the greater community
  • crowdsourcinge expertise & troubleshooting a workflow as a community was a great idea, something we could use more of!

John Pierson - EvolveLAB | RoMBIS - Denver, CO:
RoMBIS event page

  • introducing the Beaker package
  • breaking up stacked walls in Revit into their individual wall elements
  • submit a node idea to EvolveLAB to incorporate into Beaker (bottom of linked page)
  • querying elements in Revit that are not tagged
  • various tips & tricks recently discovered

Cesar Escalante - HOK | SFDUG - San Francsico, CA:
SFDUG event page

  • re-aligning ceiling-hosted families to center of ACT or other ceiling patterns
  • check out his recent tutorial video of this specific workflow!

Dynamo Block Party portion begins at 00:11:30.

Dynamo Block Party
Join us for the Dynamo Block Party -- the first meeting of its kind where several user groups across the country congregate virtually!

This is an excellent opportunity to meet others with a shared passion for Dynamo and design technology, see how their groups are organized, and be exposed to work happening outside the local community. Learn how folks in San Francisco, Denver, Des Moines, and New York City are making the most out of the expanded capabilities Dynamo provides. With 5 meetings in 1, this is one you don't want to miss.

When: April 18, 2017
Where: BSA Space - Boston

More information at the Boston Society of Architects.

Presentation slides and datasets [for the Dynamo-litia presentation] can be downloaded HERE.

The Role of VDC - From the Eyes of the New Hire


An article was recently posted on the Tocci Blog describing how my architecture experience enriches the transition to construction and what my new role in Virtual Design and Construction entails...


I recently made the transition from architectural practice to a Virtual Design and Construction (VDC) role here at Tocci Building Companies . A VDC Specialist’s role is to support project teams prior to and during construction by collaborating with all project team members (Owners, Architects, Civil, Structural and MEP Engineers, and Trade Contractors).

It is our job to:

  • Visualize and communicate items clearly to ensure design intent is properly executed to its fullest extent.
  • Preserve budget and enhance schedule by identifying and resolving constructability issues before they surface in the field – where they are more costly.
  • Look for new tools and workflows to better connect designers and builders.

Early in the process the VDC Department at Tocci strives to build good rapport with designers, consultants, and trades. One concept we use is “Confirming RFI” – when VDC encounters an issue, a handful of potential solutions are devised so an informed conversation can ensue between the architect and builder to arrive at an appropriate solution. Innovative tactics like this help reduce the typical time it takes to research and respond.

As I acclimate to my new role, I see overlap between my experience in architecture and the essential information specific to construction. My familiarity with producing drawing sets enables me to quickly navigate the documents to find things commonly missed, undervalued, or not allotted sufficient time to complete. In addition, my background enables me to evaluate problems from a different perspective than my construction colleagues.

A tool-agnostic approach is an emerging trend in the AEC industry where an array of interchangeable software approaches is used to develop solutions. My visual programming proficiency – namely the Dynamo add-in for Revit – is something unique I bring to the table. Using this skill I can dissect BIM models with much more precision and efficiency than previous methods. In addition, I am able to adapt existing and develop new workflows to better facilitate the estimating, design validation, and coordination processes.

Beyond Tocci’s dedication to mentorship and the betterment of my craft, I am most excited to work at a company so willing and eager to rethink the way buildings are built.

Dynamo-litia Boston - February 2017

SGH delivered a captivating presentatation about how they are developing web apps to simplify client process.

ASKSGH (Faster than ASAP):
Did you just come up with a new awesome design you would like to be reviewed at 6pm? …and unfortunately your engineer already left the office?

What if you could have instant structural feedback while designing your project?

Are you out of the office when you really need to review the design process?

Wouldn’t it be great if you could share your design in a real-time with your team and with anyone regardless where they might be?

Juhun Lee, Computational Designer at SGH, will present recent SGH computational work that provides “Client-Friendly” design workflows covering Revit/Dynamo, Rhino/Grasshopper, Web applications, and beyond.

When: February 15, 2017
Where: BSA Space - Boston

More information at the Boston Society of Architects .

Presentation slides and datasets can be downloaded HERE .

AEC Technology Hackathon 2016


Last month I had the pleasure of attending the fourth annual AEC Technology Symposium and Hackathon put on by Thornton Tomasetti's CORE Studio in New York City. The symposium kicked off with many fantastic speakers, I highly recommend checking out the full videos of the presentations over on the TT CORE Studio Youtube playlist. As with last year's symposium, I was personally most impressed with the work presented by Luc Wilson and Mondrian Hsieh demonstrating the use of computational design and custom digital tools for urban planning and visual analysis with Kohn Pedersen Fox's Urban Interface.

This year was also my first ever participation in a hackathon. I registered with the goal of teaming up with technology enthusiasts and individuals from other disciplines to see if I could help develop a solution for some of the pain points frequently encountered during the design and documentation process. My hope was that I could leverage my Dynamo knowledge and experience in frequently uncovering barriers in architectural practice to learn something about coding bespoke applications and user interfaces from those more familiar with the software side of the industry.

Image courtesy of Thornton Tomasetti CORE Studio

Image courtesy of Thornton Tomasetti CORE Studio

The goals of the hackathon were simple...
This event is organized for programmers, web developers, and AEC experts to collaborate on novel ideas and processes for the AEC industry. The focus will be on digital/computational technologies that have been used on projects, the lessons learned from them, and how it impacted the overall project workflows. The Hackathon aims for attendees to learn new skills, generate new ideas and processes for the AEC community through data-driven design and customized applications.

Everyone had approximately 24 hours to assemble teams, formulate an idea, and get to work trying to create a prototype. After the 24 hours, each team was to report out on what they had created and a panel of judges would determine the winners. For the first hour, individuals from the group of 60 or so hackers had a chance to pitch their ideas and attempt to attract a team. Following introductions, everyone mingled and quickly decided which topics they found most interesting and figured out what skill sets were required to fulfill the goals of the project.

The team I joined forces with all were attracted to an idea originally proposed by Timon Hazell:
When continuously exchanging Revit models among constituents on a building project, it is a time-consuming process to track down what changed between versions. In an ideal world, the architects, engineers, or consultants who are sending the updated model will write a summary or list the changes but this rarely actually occurs. Therefore, the traditional approach typically involves a painstaking process of opening both models simultaneously on separate monitors and spotting differences via visual comparison. Is there a better way to see what has changed between two versions of a Revit model and analyze just how much has changed throughout the project?

We ended up with a fantastic team of diverse perspectives to tackle this problem:
Me - represented the architecture side: knowledge of project delivery, recurring challenges, and opportunities for process optimization
Timon - represented the engineering side: spends significant time receiving and interpreting design intent from the architect with little documentation of changes
Charles - represented the consultant side: acoustician with decades of architecture experience, also regularly receives design intent from the architect and must intepret
Matt - represented the software side: experience developing custom digital tools and troubleshooting prepackaged software solutions to enhance AEC production

From left to right: Kyle Martin, Matt Mason, Charles Prettyman, Timon Hazell

From left to right: Kyle Martin, Matt Mason, Charles Prettyman, Timon Hazell

The first step was to define the problem: what are all the factors that constitute a change in a Revit model? After some brainstorming we identified 4 key change types:

  1. Elements added to the model
  2. Elements deleted from the model
  3. Family type or information parameter changes
  4. Geometry changes: location, shape, or size

We set out to create a two-part solution to this problem. First, a C# Revit add-in that essentially acts as a "diff" to compare all Revit elements between two models and generate a list of viewable items. Second, a JSON file and accompanying Dynamo workflow that would produce a data visualization for targeting concentrations of changes throughout the project.

Our trusty C# guru Matt immediately began coding the Revit add-in while the rest of the team created sample Revit models and cartooned out the data visualization component. After many hours of relentless coding, the first add-in prototype was ready to test. With a few rounds troubleshooting we were able to isolate the first list of altered Revit elements and export the first JSON file. The parameters associate with each Revit element contained within the JSON file allowed us to start building a Dynamo definition to restructure and visualize the data using the Mandrill package from Konrad Sobon. By early morning we had a working Revit add-in that mostly accomplished what we were looking for and began working out the kinks in the Dynamo workflow. As time began to evaporate in the final hours, we scrambled to test and troubleshoot the tools, assemble our presentation, and develop documentation. Ultimately we decided on the name Metamorphosis to represent the transformation of Revit models over time and their evolution into thoroughly-coordinated built form.

At the end of the Hackathon, approximately a dozen projects were presented to the judges in 5-minute maximum time allotments. Our team tried our best to efficiently explain the initial idea and walk the crowd through how the tools developed were a viable solution that would be easy to deploy to the average Revit user. After some deliberation, the winners were announced and we were thrilled to find out that we took second place largely in part because of the practicality of the problem we chose and the willingness to share our solution as open source.

And the development didn't stop there...

Following the hackathon, the code was improved in the Revit add-in to fine-tune some of the desired features. In addition the Dynamo definition was cleaned of its hackathon-induced spaghetti and properly labeled. And most importantly, everything was updated and organized into a GitHub repository.

INTRODUCING "METAMORPHOSIS" - An Open Source Revit Change Analysis Tool
Running the model comparison add-in results in a list of Revit elements that can be filtered and re-sorted. Clicking on the categories and individual elements adds them to the selection in the active view and zooms to their location.

List of changed elements sorted By Category (left) or By Change Type (right)

List of changed elements sorted By Category (left) or By Change Type (right)

Clicking the Color Elements button will apply Override Color in View to all elements that fall under 3 change types:

  1. Green - New Elements
  2. Blue - Geometry Change (size or shape)
  3. Red - All Other Changes: modifications to parameters, location, rotation, etc.
The Color Elements feature works any view type: plan, RCP, section, 3D axon, etc.

The Color Elements feature works any view type: plan, RCP, section, 3D axon, etc.

For some of the change types, an Analysis Visualization Framework (AVF) object appears:

  1. A box for an element that has been removed
  2. Arrow(s) for an element that has changed location (in the case of elements like walls, there are two location points so you get two arrows)
  3. A symbol if an element has been rotated

On the Dynamo side, opening the .dyn file and browsing to the exported JSON file will process the accompanying data for visualization in Mandrill. Clicking "Launch Window" in the Report Window node to the far right will open up the interactive data visualization window containing 4 chart types:

  1. Donut Chart (upper left) - number of changes by element type
  2. Stacked Bar Graph (upper right) - number of changes by change type
  3. Bar Graph (lower left) - percentage of items changed vs. total number of items for each category
  4. Parallel Coordinates (lower right) - number of changes for each level, each overlapping line represents a different Revit element category

METAMORPHOSIS VALUE SUMMARY

  • colorize elements in any active view to quickly identify changes, much more efficient than previous methods
  • color by change type allows you to target specific changes
  • sorting, filtering, and element selection in add-in interface allows for quick location and isolation of elements
  • quickly evaluate where most changes are occurring with analytics/visualization, this is particularly useful if the model comes with no documentation
  • compare current state to any previous model, helpful to tell the story of location and amount of changes over time
  • not just a tool for coordinating/viewing changes but making sure you cloud revisions as you go if the drawing set has already been issued


Interested in trying this tool out? Here is where you can access the datasets and learn more:

Github Repository
DevPost page
Presentation slides
Youtube Screen Capture Demonstration


In the end I got exactly what I wanted out of the hackathon experience. I was able to work with three individuals who possessing completely different skill sets than my own. I provided the team with background context and understanding of the problem from an architectural perspective so that we could devise a technological solution. More specifically, Timon and I pushed ourselves to utilize tools that we would not regularly encounter in practice and capitalize on the opportunity to learn the Mandrill package for Dynamo, JSON data formatting, Revit add-in configurations, and establishing a GitHub workflow for sharing and maintaining associated files.

A huge thank you goes out to the Thornton Tomasetti crew who worked so hard to put on such a well-executed event. Thanks to the judges who volunteered their time to hear all of our frenzied, sleep-deprived 5-minute-plus presentations. Lastly, shout out to my teammates who all worked tirelessly to make our idea a reality!

Dynamo-litia Boston - December 2016

This installment of Dynamo-litia Boston was generously hosted by Sasaki and highlighted all of the professional engagements Dynamo-litia Boston community members were involved in for Fall 2016.

The Expanding Universe of Visual Programming, Interoperability and Community:
It has been a very busy fall with several members of the Dynamo-litia community attending recent conferences. We will start things off by sharing current events and acquired knowledge from ACADIA, Autodesk University, ABX, and AEC Technology Symposium and Hackathon. One of the great strengths of Dynamo is the ability to connect a wide array of software platforms, expanding the toolset available to architects and designers. Please join us as we demonstrate sample Grasshopper workflows and explore the ways that the visual programming principles utilized relate directly to Dynamo processes. The session will conclude with an exploration of the immediate value Dynamo brings to practice and a live demonstration of how it interfaces with Revit.

When: December 13, 2016
Where: Sasaki Associates - Watertown

More information at the Boston Society of Architects.

Presentation slides and datasets can be downloaded HERE.

Recapping an Unforgettable Week of Design Technology


AUTODESK UNIVERSITY 2016:
On Monday, November 14 I took the stage in front of 80 eager faces to help explain what in the world is Dynamo and how does it apply to the work that I do? For the fourth consecutive year, Autodesk University in Las Vegas began with a pre-conference Computational BIM Workshop. This year I received an invitation from the Dynamo production team (headquartered in Boston) to co-teach one of 3 sessions -- 2 Beginner and 1 Advanced. After a general introduction to what Dynamo is and how it functions, we covered topics such as: basic parametric principles, geometry generation, Revit element instantiation, Excel interoperability, and BIM parameter modification. It was really fun to not only teach such a large group of brand new adopters but to walk around the room and see the diversity of experience and computer skills. With nearly 250 combined workshop attendees and over 49 Dynamo course offerings at Autodesk University this year, it is clear that Dynamo is emerging as an essential tool in the AEC industry.

Monday night concluded with several networking events where I had the pleasure of meeting many renowned Dynamo enthusiasts from around the world who I had only communicated with through social media, blogs, and email. Highlights include: many members of the Dynamo team, the founders of several other Dynamo user groups, the Flux.io development team, and other various colleagues, consultants, and computational designers and technologists.

East & West Coast user groups unite. Me with Cesar Escalante, founder of the San Francisco Dynamo User Group.

East & West Coast user groups unite. Me with Cesar Escalante, founder of the San Francisco Dynamo User Group.

On Tuesday I had the fortune of attending a full schedule of courses including:
Revit Analytics with Dynamo
Revit API for Designers -- Use Cases for Extending Creativity
Design Strategies with FormIt 360
The Future of BIM Will Not Be BIM -- and It's Coming Faster Than You Think

The entire trip culminated with my participation in a Dynamo Design Slam in front of a live audience in the Exhibit Hall. We were tasked with the following challenge:
Design the Las Vegas Strip’s newest attraction, hotel, or casino using Dynamo. But, do it live, on stage, Iron Chef-style against three other people, all in 30 minutes!

After a colorful introduction for each champion where I was affectionately dubbed "The Colossus of Color" (among other things), every move in the heat of competition was commentated by Anthony Hauck and Ian Keough.

Mid-Slam - all the competitors racing to finish their geometry using Dynamo.

Mid-Slam - all the competitors racing to finish their geometry using Dynamo.

Post-Slam - from left to right: Ian Keough, Me (competitor), John Pierson (Winner), Aparajit Pratap, Ritesh Chandawar, Ian Siegel (competitor), Racel Williams, Zach Kron, Colin McCrone (competitor), and Anthony Hauck. Image courtesy of Aparajit Prat…

Post-Slam - from left to right: Ian Keough, Me (competitor), John Pierson (Winner), Aparajit Pratap, Ritesh Chandawar, Ian Siegel (competitor), Racel Williams, Zach Kron, Colin McCrone (competitor), and Anthony Hauck. Image courtesy of Aparajit Pratap.

The competition was an absolute blast but in the end I did not emerge the winner, congratulations John! 30 minutes is barely enough time to make anything significant in Dynamo but here is the result I was aiming for:

Full Dynamo definition available HERE.

Full Dynamo definition available HERE.

The moment the Design Slam ended, I hopped in an Uber for the airport and caught the red eye flight back to Boston to prepare for my looming ABX presentation...


ARCHITECTURE BOSTON EXPO 2016:
After a short day of recovering from Autodesk University, I prepared for an 8am presentation at ABX2016 on Thursday, 11/17 with my colleague Jason Weldon [LinkedIn]. Our talk was titled "Arrested Development: Design Technology & Expediting Process" and showcased the use of various technological approaches for performing feasibility studies, data visualization, and design validation.

We started things off by exposing the audience to others' work that has inspired us over the last year and then walked through a case study that demonstrates how tools easily available to most offices--Revit, Dynamo, Excel, PowerBI, and web visualization--can significantly enhance and expedite tasks commonly encountered in architectural practice. Our intention was to help strengthen the Boston AEC community through our message that these tools are approachable and highly beneficial.

To learn more about our case study, please check out my blog post Automated Feasibility Project - Part 2.

In the months leading up to ABX2016, I joined forces with MakeTANK to help with the design of a pavilion for ABX. The MakeTANK is a committee at the Boston Society of Architects committed to exploring the surging role of digital fabrication, making, and material innovation in the Boston AEC community. The Pavilion was an overwhelming success and I was very proud to have participated in it's conception alongside individuals from: Jaywalk Studio, Sasaki, Shepley Bulfinch, CW Keller, SMMA, Studio NYL, Bluebird, and many other Greater Boston Area offices. On Thursday afternoon I helped the team deconstruct the Pavilion to be stored for future appearances at other local design events.

For more information about the founding of MakeTANK at the BSA and the creative process that went into the realization of the Pavilion, you can read my blog post MakeTANK Pavilion.


DLR GROUP - Des Moines:
By Friday, 11/18 I found myself in Des Moines, Iowa preparing for some rest and relaxation on a personal vacation however it would not be a successful journey without stopping by DLR Group to visit my friend and fellow Design Technology enthusiast, Ryan Cameron.

Ryan generously offered the opportunity to be a guest in a series he has been running internally called DLR Dynamo Next. I enjoyed presenting virtually to a handful of offices about the value and ease of use of Dynamo. I even got to drop a plug for the Dynamo-litia and encourage participation in the global user community. It was really enjoyable to meet some new folks and share my experiences.

...And to my complete surprise, a few weeks later a coffee mug with my personal logo mysteriously arrived at my desk back in Boston. As an act of gratitude for my visit -- and a perfect example of classic Midwestern generosity -- it turns out that Ryan was the sender. Thanks Ryan!

image 10_coffee mug.png

In the end, the entire week was a whirlwind adventure but the experience of a lifetime!

Automated Feasibility Project - Part 2


One of the earliest personal research projects for me using Dynamo was the concept of automating the traditional feasibility study process in architecture. When working on commercial and multi-family residential projects, developer clients often explore several properties to see which have the most potential for financial returns on investment. The client typically requires a feasibility report in a matter of days or even hours to quickly give insight on whether to pursue a property or not. To provide this data often requires me to maximize our efficiency within the time allotted.

The feasibility study process is highly repetitive and ripe for automation. Regardless of the site; conditions such as lot size, zoning, code requirements, public right-of-ways, and various other factors set constraints that can serve as a starting point a parametric model. Once built in Dynamo, a multitude of inputs can be flexed to explore different outcomes. More often than not the developer is looking for total area, number of levels, specific program mixture, floor-area-ratio (FAR), and other factors to create pro formas and evaluate the financial viability of pursuing the project. Having a flexible, easy-to-adjust parametric model allows for rapid test fits and option generation. Emerging web and data visualization tools further enable sharing and input with team members and clients.

In August of 2015, my colleague Jason Weldon and I made a first pass at building an approach using Dynamo based on experiences we had encountered in practice. This first Dynamo definition was error-prone but built a foundational understanding of how to structure for parametricism and how the resultant information could be extracted to satisfy the typical deliverable. It was this baseline project that inspired a second round of research for a presentation at Architecture Boston eXpo 2016. In preparation for ABX, we made the decision to specifically utilize a tool set readily available to most architecture offices: Revit, Dynamo, Excel, PowerBI, and web visualization.

The first step was to develop a system in Dynamo that could apply setbacks to any edge of a property shape regardless of size, angles, direction, and other characteristics of the geometry. The original attempt at this project revealed that using visible geometry -- points, lines, surfaces, solids -- was unreliable and at times computationally taxing. In Dynamo there are currently tools to evenly offset a shape in a chosen direction but there is not an easy way to pick and choose some edges to offset while keeping others in their original location. The most efficient approach would be to use vector calculations and plot the new corner point coordinates provided the property boundary lines and desired offset distances.

For any given corner, this mathematical strategy calculates the offset distance along the adjacent/opposite angles (SOH-CAH-TOA) and plots the new point location. After each corner is repositioned, a brand new polygon is established that represents the maximum build area for that site.

This Dynamo definition now becomes a universal mechanism for applying setbacks to any property shape. Polygons from software platforms such as Revit, Adobe Illustrator, or CAD can be fed into Dynamo to begin a feasibility analysis. As a test, I created an array of various 6-sided polygons and applied a different offset to 2 of the 6 sides. The resultant shapes could then be extruded to a maximum allowable height and produce floor plates at a set floor-to-floor heights in order to assess the total area of each site.

Once the foundation was established for a Dynamo approach, we kicked off a case study by looking at the criteria of fitness for evaluating what constitutes a satisfactory design outcome. Factors like density, usable area, design aesthetic, budget, and function all play an important role in the success of a project and it is crucial to set targets early on. A sample site was chosen and a list of site assumptions were compiled to begin establishing Dynamo constraints.

From this property shape we decided to isolate and compare 3 schemes for their proximity to a target FAR -- thus revealing the most efficient design. The steps in Dynamo included applying the required setbacks to the property boundary, specifying the maximum building width to allow for circulation and residential unit size, generating floor plates for as many level as can fit within the maximum allowable building height, and locating the corridor and means of egress, which will eventually be subtracted from the overall residential area.

Creating a flexible and reliable Dynamo definition paves the way for further analysis and visualization. The file can be posted to the Dynamo Customizer -- a shareable web interface where others can orbit around the 3D model and change the input sliders to adjust the geometry real-time. The Customizer is an excellent way to keep team members or clients up-to-date with the latest schemes or elicit feedback to allow them more agency in the design process. Another powerful tool that can be used -- Project Fractal -- runs your Dynamo definition through the cloud to analyze a design space of possible inputs and help the designer determine the configurations that best meet the criteria of fitness. For this case study we put the U-shape scheme in Project Fractal to test which arrangement of input dimensions results in a total Gross Area closest to the target FAR (without going over).

Check out this Project Fractal visualization for yourself HERE (must sign in with an Autodesk ID to access).

Check out this Project Fractal visualization for yourself HERE (must sign in with an Autodesk ID to access).

The geometry generated within Dynamo provides an excellent visual representation of early design explorations but ultimately the geometry is only a placeholder for corresponding calculations of area and program mixture. Calculations from the geometry should be set up to not only establish a simultaneous read out within Dynamo but allow for export to other calculation and visualization platforms such as Excel and PowerBI. For our case study, the finalized Dynamo geometry was exported to a blank tab in Excel and queried by a color-coded table of calculations. Based on the fixed Approximate Unit Areas for each residential unit type and desired Percentage of Total Units, the gross residential area extracted from each floor in Dynamo can be divided up to approximate the number of total units of each type and total beds per floor. At the very bottom of the table, the approximated unit mixture can again be compared to the target value to see how much area was omitted during the calculation process -- this example returned a total unit efficiency of 97%, not bad! Remember that this table only represents a preliminary study. As the design goes into Revit for bespoke modeling and when a diversification of unit mixture among floors is desired, a similar strategy between Revit, Dynamo, and Excel can be established to evaluate the precision of those changes.

Raw data populated in Excel from Dynamo also opens up the option for more powerful visual analytics tools like PowerBI. PowerBI is a free tool from Microsoft that allows you develop customized dashboards for any data source. Areas per level, unit mixture, program, FAR, and other feasibility metrics can populate easy-to-read graphics to share with the client and project constituents. If data is captured over time from all the design iterations, charts can be created that illustrate the evolution of the project.

"Hey, this doesn't look like architecture..." You're correct, read about this sample PowerBI dashboard HERE.

"Hey, this doesn't look like architecture..." You're correct, read about this sample PowerBI dashboard HERE.

An important final step is the seamless transition from feasibility massing to a Revit model. The geometry established in Dynamo can easily be used to begin instantiating generic floor, wall, roof, glazing, and other Revit elements that kick-start the documentation process and eliminate the need for project staff to tediously translate the entire design.

Image courtesy of Shepley Bulfinch.

Image courtesy of Shepley Bulfinch.

To wrap up this case study, we decided to also address the use of Dynamo to test out various parking garage configurations. Several months ago I built a definition for evaluating the maximum possible parking spaces that could fit within given site dimensions. The system was designed for a single-helix structure and would adjust the number of parking bays in accordance with minimum code distances for parking spot size, drive aisle width, ramp slope, turn radius, etc. If a required number of spots is established during the feasibility study process for a particular development project, an array of garage layouts and dimension configurations could be fed through Project Fractal to see which combination arrives closest to the target quantity. While this does not necessarily design the entire parking garage automatically, it is an excellent means to rapidly assess dozens or even hundreds of possibilities and validate a particular decision.

So why is all of this research important? Feasibility studies are a perfect example of a regularly repeated process in architecture built on a list of simple variables. Computers and emerging digital tools offer the opportunity to create a formula for rapidly producing a similar outcome. Furthermore, test fits can be altered, iterated, and shared faster than ever before -- buying back time that can be re-invested in delivering more thoughtful and innovative design.

Shout out to Eric Rudisaile for helping me think through the final steps of the vector approach to variable property offsets in Dynamo. Vectors are extremely efficient but their invisibility makes them tricky to troubleshoot, Eric helped me revisit math I hadn't used in a decade!

MakeTANK Pavilion


In June 2016 a new group emerged at the Boston Society of Architects dedicated to exploring the expanding role of digital fabrication and making in the AEC industry. Their mission was stated as follows:

MakeTank! supports the maker cultural revolution by exploring and advancing knowledge of making as an extension of architectural investigation through presentations, small group discussions and member-run training sessions with this friendly peer learning group.

MakeTANK Launch event at the BSA Space. Image courtesy of Chris Hardy.

MakeTANK Launch event at the BSA Space. Image courtesy of Chris Hardy.

By the second meeting, MakeTANK had identified the perfect opportunity to bring together designers and makers from all over Boston -- design a pavilion for Architecture Boston eXpo 2016! The group dove into materials, patterning, and precedents. After several weeks of discussion and preliminary ideas, I was asked if there is any way Dynamo can contribute to the modeling and testing phase of the design.


FORM:
To be able to use Dynamo in any way to support the development of the pavilion, I first needed to gain a better understanding of the design concept. The team had decided to focus on a simple centenary arch shape for stability and ease of construction, with an emphasis on material and structural innovation. Early in the process, we realized that the use of any flexible material would create more propensity for bowing/buckling on the sides so strategies for a wider and sturdier base were necessary.

I began by producing a few hand sketches -- as I do so often in preparation for complex tasks in Dynamo -- before deciding that the quickest way to test out my design ideas was to create a sketch model out of paper. This allowed me to play with the proportions, scale, and think through the parametric constraints that eventually evolved into a Dynamo "sketch model" featuring a more elegant solution to stabilizing the base with tent-flap-like elements.

The Dynamo file for this "sketch model" can be downloaded HERE.

The Dynamo file for this "sketch model" can be downloaded HERE.


MATERIAL:
When the planning reached the consideration of materiality, Haik Tokatlyan and Steve Listwon from Jaywalk Studio came through with a brilliant idea for a rigid structure with flexible connection points that would allow for a gentle flexing of the pavilion humorously referred to at the "Jiggle Factor" -- or "J-factor" for short. They developed a few mock-ups of an assembly that fused wooden members with cast silicone nodes by pouring the pre-cured silicone through holes in the ends of the intersecting wood pieces then allowing it to cure into a hardened but pliable joint.

The flexible pavilion concept was a hit with the group and they set out to create more tests for the proper amount of flexibility, structural support, and steadfast adhesion to the wood. Finding the right durometer required mad-scientist experimentation with hardening agents, cure time, and temperature to strike the perfect balance. Ultimately Haik and Steve settled on using a urethane compound for its improved rigidity over silicone and the translucent red color was a nice bonus.

A casualty of the material testing process.

A casualty of the material testing process.


PATTERNING/STRUCTURE:
Another critical consideration to ensure structural whimsy and avoid a catastrophe was the orientation of the nodes around the structure. Several options were looked at, including: Arranging nodes in horizontal or vertical striations would provide stiffer rib segments. A gradient of increasing flexible nodes would introduce more jiggle towards the top of the pavilion while maintaining stability at the base. Variation in the stiffness of targeted joints would produce different movement throughout as well. Ultimately the team settled on an even distribution of nodes with a uniform durometer, leading to an emphasis on the chosen pattern for stability.

Many patterns were investigated in the effort to find equilibrium between aesthetics and structural integrity. Of all the triangle, rectangle, pentagon, and hexagon permutations, the classic Cairo pentagonal pattern was chosen as having an ideal balance of regularity and simplicity. Although at first the logic of the pattern seems to comprise of simple overlapping elongated hexagons, there is actually a precise mathematical relationship between the angles and shapes. Dynamo does not yet have any nodes or custom packages for Cairo patterning so I set out to develop a definition that could generate the pattern along any input surface. In the end I got something that resembled the pattern applied to a barrel vault but was not accurate enough for fabrication nor structural analysis.

Image courtesy of Ilaria Giardiello.

Image courtesy of Ilaria Giardiello.

The Dynamo definitions for these pattern experiments can be downloaded HERE.

The Dynamo definitions for these pattern experiments can be downloaded HERE.

Once materials, pattern, and node distribution had been decided, an easy way to test variations was to create physical models using the laser cutter. This approach allowed for rapid prototyping and much more flexibility in testing different pattern combinations. The addition of scale figures helped the team get a sense of the space underneath the vault and imagine how the pattern would eventually look at human scale.


FABRICATION:
When it came time to begin refining the parts, the folks over at Sasaki and Jaywalk Studio used a CNC Router to develop different versions of the wood members and carve molds out of high-density plastic for casting the urethane nodes. The CNC was also used to cut smaller components as the assembly became more intricate and a parts catalog was eventually created to keep track of all the pieces.

Image courtesy of Felipe Francisco.

Image courtesy of Felipe Francisco.

Image courtesy of Brad Prestbo.

Image courtesy of Brad Prestbo.

Image courtesy of Chris Winkler.

Image courtesy of Chris Winkler.

Early mock-ups helped inform material modifications and introduced the need for strategic reinforcement in certain portions. With a looming deadline, a smaller segment of the pavilion was constructed using finished pieces to test the resilience of the materials under the stress of extreme jiggle and make final tweaks.

Image courtesy of Haik Tokatlyan.

Image courtesy of Haik Tokatlyan.

Following the final testing phase, the team gathered in several evening and weekend sessions to assist in the casting, cutting, sanding, and small parts assembly processes.

Image courtesy of Brad Prestbo.

Image courtesy of Brad Prestbo.

Image courtesy of Brad Prestbo.

Image courtesy of Brad Prestbo.

In the week leading up to ABX, a few final meet-ups helped work out all the kinks with assembling the finalized components and choreographing the installation at the convention center. This was also the first time the team got see the full creation and test out the J-factor.

Image courtesy of Brad Prestbo.

Image courtesy of Brad Prestbo.

Image courtesy of Sasaki.

Image courtesy of Sasaki.


The pavilion ultimately turned out to be an overwhelming success at ABX2016. With prime real estate near the entry to the Exhibit Hall, many attendees were instantly drawn to the bright pop of red color and tantalizing sway of the canopy. It served as a perfect venue for several talks and presentations throughout the week, including live demonstration of the casting process by Jaywalk studio and occasional presentations of the fabrication process from the MakeTANK team. Additional pedestals and pieces of furniture throughout the space further promoted methods of making and provided an inviting reprieve from the busy showroom floor.

I am very proud to have been a contributing member of this project and thoroughly enjoyed meeting and working alongside colleagues from all over the Greater Boston Area who share a passion for craft and design. Keep an eye out for more inspiring creations to emerge from MakeTANK in the future!

Image courtesy of Jessica Purcell, Shepley Bulfinch.

Image courtesy of Jessica Purcell, Shepley Bulfinch.

A BIG thank you goes out to Brad Prestbo and Ryan Salvas who founded MakeTANK group, especially to Brad for all of the organization and leadership during the pavilion project. This thing would have never been possible without all the generous contributions of local companies and individuals who donated money, materials, and countless hours of personal time. I would also like to thank my employer Shepley Bulfinch for graciously co-sponsoring the pavilion and providing funds to make it a reality.

For more information about the founding of MakeTANK at the Boston Society of Architects and the creative process that went into the realization of the pavilion, I highly recommend checking out the profile pieces written by the Neue Guild -- MAKETANK: PART 1 and MAKETANK: PART 2 (coming soon, stay tuned). While you're over there, you might as well create a user profile and join the community of talented designers and collaboration opportunities they regularly promote.

Space Planning Update


In October, 2015 an approach I developed for space planning and programming using Dynamo was posted on the Dynamo Blog and now resides as a Use Case on the Dynamo website -- you can read about the original version in THIS BLOG POST. Since then, I have corresponded with dozens of individuals who have reached out with questions and clarifications about the workflow. As one of my earliest attempts at annotating a Dynamo definition, the flood of inquiries I received soon after pointed out some basic mishaps in the notes. In addition, the original Dynamo file was created in Dynamo 0.8.2 and the combination of new Dynamo version releases and custom package upgrades caused the occasional headache. Regardless of minor glitches and clarification, I have proudly watched as this workflow has continued to execute flawlessly over time with little to no modification and has inspired many others to adapt it to their specific needs.

One of the first people to share with me how they had put this approach to work was Brian Nickel who applied it to his studies in the architecture program at Montana State University.

Image courtesy of Brian Nickel. Read more about this image on his blog The Revit Saver.

Image courtesy of Brian Nickel. Read more about this image on his blog The Revit Saver.

Nearly a year later Brian followed up with an impressive demonstration of how the same functionality in Dynamo could be piped into FormIt 360 for reshaping into architectural form. This is an excellent example of how generating massing shapes from a list of program can seamlessly begin to generate architecture without a lengthy translation process across mediums.

Image courtesy of Brian Nickel.

Image courtesy of Brian Nickel.

Another fantastic example of how the space planning workflow can be utilized came from Ryan Cameron who showcased the use of Flux populate the program and visualize the blocks.

Image courtesy of Ryan Cameron.

Image courtesy of Ryan Cameron.

With the recent debut of within-node list management functions in Dynamo release 1.2.0, an update to the Space Planning definition was long overdue. Zach Kron came through with an adaptation that drastically reduced the overall number of nodes and satisfied the majority user needs with simple object spacing and an override color in view vs. material approach.

Image courtesy of Zach Kron.

Image courtesy of Zach Kron.

I finally found the time to evaluate, annotate, and update the original and sample datasets can be obtained HERE. Some re-organization and general cleanup occurred but the new definition essentially functions the same way as the original.

Now how could I possibly compare the number of nodes in each version to see how much more efficient the update is? I remembered that awhile ago I saw a Tweet from Andreas Dieckmann showing how to evaluate the composition of nodes used by parsing the .dyn file with Dynamo... genius! Analyzing both the original and new .dyn files reveals nearly 25% less nodes (32 total) in the new version.

Parsing and comparing the two .dyn files. A sample definition can be obtained HERE.

Parsing and comparing the two .dyn files. A sample definition can be obtained HERE.

I am thankful to the always-amazing Dynamo community for your open source spirit and insatiable curiosity. I am glad the space planning definition has helped so many and I look forward to seeing people show off their future interpretations.

Fuzzy String Matching with Dynamo

Eric Rudisaile and I recently collaborated on a post for the Dynamo Blog highlighting a package he recently published called FuzzyDyno. This package includes a few nodes for fuzzy string matching, an algorithmic approach to approximating matches between words. Tools like this are a perfect example of how computer science principals are gradually being incorporated into Dynamo through the hard work of independent developers and advancing the usefulness for architectural production. Read the full article HERE.

Dynamo-litia Boston - October 2016


This second Dynamo-litia workshop featured a live demonstration of modifying Revit parameters using Dynamo.

Workshop Description:
Back by popular demand! This session will showcase several practical workflows for everyday Revit production. If you are still wondering how Dynamo applies to the work regularly performed in architecture firms, this is the perfect chance to find out. The majority of the meeting will be devoted to a live demonstration and attendees will be encouraged to follow along. No prior Dynamo experience necessary; users of all levels welcome.

When: October 20, 2016
Where: BSA Space - Boston

More information at the Boston Society of Architects.

Apologies for the abrupt ending. The battery on the recording device died right before resolving and fully explaining the Element.SetParameter function but this video contains 99% of the relevant content. Presentation slides and datasets can be downloaded HERE.