Recently I submitted a write-up to Autodesk on how Dynamo is used at Shepley Bulfinch to streamline the programming and space planning process in Revit. Today the write-up was posted to the DynamoBIM Blog, check it out HERE .

Recently I submitted a write-up to Autodesk on how Dynamo is used at Shepley Bulfinch to streamline the programming and space planning process in Revit. Today the write-up was posted to the DynamoBIM Blog, check it out HERE .

If you missed the first ever Dynamo-litia meeting at the Boston Society of Architects, you can now watch the video
HERE
.


Hebron Harvest Fair Rodeo - Hebron, CT
Growing up in the agrarian state of Oregon, attending local rodeos during the summer was a favorite family activity. The raw athleticism, toughness, and tradition always made for good entertainment. The humility, sense of community, and incredible treatment of livestock instilled a deep admiration for the country folk for whom rodeo is their entire livelihood.
Unlike most professional sports, the cowboys and cowgirls are responsible for personally funding their own equipment, horses, lodging, and transportation. Their lives consist of driving hundreds, sometimes thousands, of miles between weekends to make it to the next rodeo where they compete for a paltry winner-takes-all purse in the 4-5 figure range. A missed lasso toss, a momentary loss of balance, or an overturned barrel can be the difference between earning enough to cover a few more weeks of food, gas, and supplies, or heading to the next event empty-handed. As if the meagre earnings aren’t enough of a deterrent, the physical toll and life-risking courage the sport demands are further testament to the passion and dedication these athletes possess.
Now having lived in Boston for the better part of a decade, my rodeo participation has been reduced to the occasional visit home or sporadic television broadcasts. Recently I was ecstatic to discover a rodeo in Northern Connecticut, however I had my doubts about the level of competition and authenticity. Given that the majority of rodeos occur in the western and southern portions of the United States, I wondered how much incentive an athlete would have to drive all the way to New England to compete. My curiosity got the better of me and I decided to look for a map of all rodeos in a given season of the Professional Rodeo Cowboys Association (PRCA), only to to find that no such map exists on the internet. Thus I set out to make my own map...
Data Acquisition:
The first step was to acquire the schedule for the 2015 rodeo season. The PRCA website does not contain a cohesive schedule for the entire season but does post the remaining season schedule as well as the results of each event that has already occured. Luckily the construction of the website is very simple, which made for easy scraping of the data into a format that can be processed.
PRCA 2015 Results
PRCA 2015 Remaining Schedule
Parsing and Re-structuring with Dynamo:
After collecting the lists of information for both the remaining schedule and results, I set out to use
Autodesk Dynamo Studio 2016
to parse and re-structure the data for visualization. With the knowledge that the National Finals Rodeo event in Las Vegas in December marks the culmination of every rodeo season, I pared down all events to this timeframe, resulting in 620 total contests. This is a prime example of Dynamo as a powerful visual programming platform independent of Revit.
Visualization with Tableau:
The next step was to merge the two data sources and organize the information by: event name, city, state, country, and first day of event. Once everything was clean and consistent, I exported the data to
Tableau
for visualization. The Tableau map feature allowed me to position all 620 rodeos across the US and Canada and colorize them based on when they take place during the course of the season.

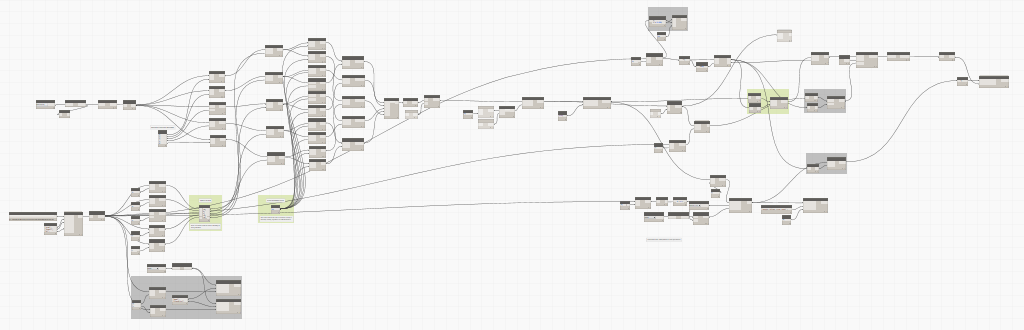
Dynamo Studio "definition" for parsing and re-structuring the PRCA rodeo data.
This article was recently published on Building Design + Construction: article
And originally posted on the Shepley Bulfinch Insight Blog: article
At the BLDGS=DATA symposium in New York this spring, the discussion focused on strategies for harnessing the massive amount of data made available by modern technology. An increased capacity for analysis has led to immense data generation and an unprecedented ability to identify correlations. The AEC industry today is grappling with ways to make the best use of it and to develop standard processes for leveraging and sharing it.
This surge of data is changing the very nature of design as architects begin to embrace a much more data-driven approach. Advances in Building Information Modeling (BIM) allow for more thorough project documentation and the ability to share building information with contractors. Intricate digital models and environmental simulation enable offsite fabrication methods and building systems improvements that have the potential to increase quality and reduce construction costs. Most importantly, access to vast quantities of data is helping design teams better understand a client’s needs and can be used to validate a particular design decision beyond previously available means.
With an increased capacity for capturing data, it is imperative not to get lost in the white noise. The seemingly limitless stockpiles of information must be strategically vetted for meaningful interpretation with a focus on the value it provides to the process and the end product. One of the most evident attempts to find a balance between data and technology is the current infatuation with computational design, with its powerful new software platforms, intricate parametric tessellations, and innovative materials.
How can architecture make the most of the growing data movement? The true promise of this information age is not iteration and automation but the ability to substantiate expertise and predict outcomes.
To better position themselves to do so, architectural practices must acquire and develop new skills to be able to filter and find value in the newly available data sources. Computer science will become an essential component of design education and graduates will be encouraged to form much more integral partnerships with engineers, construction managers, and environmental sustainability experts. Architects must seek data collection and information management techniques to help inform their process, exhaust possibilities, and confirm design outcomes. The evolution of the practice of architecture is about changing our mentality and approach: broadening our thinking, not necessarily eliminating tradition. While technology is becoming a powerful tool, the most critical role belongs to the individual who, alone or as part of a greater whole, is harnessing that power.
Ultimately the AEC industry as a whole will benefit from an increasingly data-driven approach to design and construction that promotes improved communication, better quality projects, and fewer hindrances to the building delivery process.
-Kyle Martin
Kyle Martin is a member of Shepley Bulfinch’s architectural staff. He is a co-founder of the Boston Society of Architects Revit Users Group’s “Dynamo-litia” and currently teaches Advanced Revit and Computational Workflows at Boston Architectural College.

Don't miss the first ever Dynamo user group in Boston!
Tuesday, September 22nd
9am - 10:30am
BSA Space - Boston Society of Architects
RSVP Here
The inaugural meeting will provide a broad introduction to the Dynamo visual programming add-in for Revit.
I am proud to announce that I have been selected as a Co-chair for the Revit User Group at the Boston Society of Architects.
In addition, Kevin Tracy and I will be forming the new Dynamo-litia subcommittee specifically devoted to the Dynamo visual programming add-in for Revit. Stay tuned for more details on the inaugural meeting.
AUTOMATED FEASIBILITY PROJECT
A common circumstance of working with commercial development clients is producing feasibility studies to examine the value of pursuing a project on a particular site. Factors such as local zoning ordinances, building code, desired program, and site constraints all inform the buildable potential of a site and determine whether it is financially and strategically advantageous to invest in a project. Feasibility studies require the right balance of accuracy and efficient time management given the likelihood that many projects will not come to fruition.
My colleague Jason Weldon
and I are currently embarking on a project to investigate the potential use of Dynamo for automating portions of the feasibility process. The two essential advantages to this approach are buying back time for deeper investigation and the validation of proposed schemes through iteration. Automation through Dynamo will significantly reduce initial preparation and manual input of information required to start a BIM model. Alteration of computational constraints will enact changes to the model for testing schemes and instantaneous calculations provide a report for each iteration. This process promotes efficiency and substantiates certainty.
Phase 1
Zoning Setbacks, Levels, Floor-to-Floor Height, & Courtyard
All studies begin with the same ingredients: a plot plan or civil drawing and preliminary zoning research. Working from these items alone, a maximum allowable building envelope can be established. Floor Area Ratio allowances and incentive zoning can be incorporated to evaluate proportional modifications to the overall envelope.

Here I start out by collecting the property line for a site from Revit. From the property line, I am able to establish setbacks on all five edges of the site. Constraints for the overall number of floors and floor-to-floor height allow to me to quickly explore different massing compositions. Inserting a courtyard facilitates improved residential potential for the site due to increased light and ventilation. By adjusting the distance of the courtyard from the exterior face of the building, it is possible to experiment with the proportional balance of form and floor area efficiency.
Download the open source definition here .

BLDGS=DATA
Hosted by CASE Inc. (NYC)
The Standard High Line Hotel
May 28, 2015
Data For Understanding Cities
Blake Shaw, Head of Data Science - Foursquare
For those of you who have never heard of Foursquare, it was originally a mobile device app for sharing locations and activities with your social network - occasionally creating the opportunity for chance encounters when two friends find themselves in the same vicinity. Nowadays Foursquare has evolved into a powerful mechanism for tracking human behavior. With the exponential rise of people connected to the internet via mobile devices, how will the constant production of "data exhaust" be harvested and what can it tell us? How does a city behave as a living organism?
What is the most popular activity on a hot summer day (answer: getting ice cream)? Foursquare continues to examine correlations among human behaviors and asks how we can better interact with the buildings we inhabit. Everyone experiences an environment differently but how can data derived from countless previous experiences be used to inform future experiences and provide valuable recommendations? Data is the key to optimizing the potential for enjoyable experience.
Data for Building Insight - Panel Discussion
Brian Cheng, Designer & Associate - HDR Architects
Jennifer Downey, National BIM Manager - Turner Construction
Peter Raymond, CEO - Human Condition
This session started off with each person sharing a little bit about technology efforts at their companies. At HDR they are utilizing a combination of a custom dashboard and parametric modeling to analyze health care program and massing test fits. In addition, advanced model sharing and co-location methods enable instantaneous coordination with engineers and consultants. Turner presented an example of how LEAN strategies, aggressive coordination and scheduling, thorough communication, all combined with robust project data have made a significant impact at their company and played a large part in the world record setting concrete pour at the Wilshire Grand in LA. Human Condition demonstrated a construction safety vest that tracks body position, biometrics, and worker location. With the further development of wearable technology, real-time information can be gathered on every worker at the construction site and a holistic safety culture can be established through the incentives of exemplary performance.
During the discussion it was pointed out that currently in the AEC industry there is a culture of "commodification of mistakes," meaning that contingencies are written into contracts, numbers are carried for unforeseen costs, and there is a standing assumption of labor inefficiencies and injuries on the job. How can BIM be better utilized to mitigate these costly errors and how can new technologies improve job safety and productivity? Perhaps tools like clash detection and co-location make for a more streamlined design and construction process. Furthermore, BIM as a platform needs to become a mode of communication between project constituents and facilitate a timely transmission of data. Another question that emerged was how can decades of on-site construction knowledge and experience be gathered and implemented much earlier on in the design and documentation phases? Strategies like pulling seasoned construction workers into the coordination meetings and using tools like a company intranet to archive knowledge and solutions were suggested. It is also imperative to seek feedback and document the process in order to ensure continuous improvement.
Data for Retail Roll-Out
Scott Anderson, VP Global Corporate Store Planning & Development - Estee Lauder Companies
Melissa Miller, Exec. Director Corporate Store Planning & Development - Estee Lauder Companies
This team is responsible for identifying new opportunities for brand positioning within retail department stores and carrying out the requisite construction. After years of managing projects through email, Word, Excel, and Gantt charts it became apparent that tracking the transfer of information across multiple platforms was incredibly inefficient. The team set out to construct a custom dashboard that managed all communications, actions, specific information, and progress by project. Now project managers and company executives can enter the system at any time and review progress. The new system has enabled transparency and drastically reduced the duration of projects.
Data for Indoor Positioning
Andy Payne, Senior Building Information Specialist - CASE
Steve Sanderson, Partner & Director of Strategy - CASE
With the emergence of indoor positioning systems that triangulate mobile device location using Bluetooth, wireless, and GPS, a team at CASE Inc. has embarked on a project to harness indoor location data. Using a custom app created to track employee movement throughout the workday, CASE recorded one month of data and produced this analysis. From this data, it was determined that only 2/3 of space is being actively utilized in this BRAND NEW office the company just moved into. In addition, some of the program was not being used as originally intended or seldom used at all. Disregarding the potential for future company growth, CASE has wondered how the results this post-occupancy analysis would have affected the planning of the office layout prior to signing their lease. This led to a larger conversation about the opportunity for implementation in design. For example, how can this technology be applied to doctors and nurses in a health care setting to monitor their daily routines and learn more about the way spaces are truly used? The potential for better understanding of human behavior and the development of theoretical simulations to analyze building program is very exciting.
More about the development of the app and beacon technology...
Data for Building Buildings - Panel Discussion
John Moebes, Director of Construction - Crate&Barrel
Doug Chambers, CEO - FieldLens
Todd Wynne, Construction Technology Manager - Rogers-O'Brien Construction
These three gentlemen discussed coordination and the use of data to avoid significant delays in project timeliness. At Crate&Barrel, many of the Autodesk software products are used on a small project team to design and build new stores throughout the world. Careful documentation allows the Crate&Barrel to bring the procurement of steel and materials in-house at a significant cost savings and drastically reduce the possibility of mistakes in the field that affect valuable components of retail design. FieldLens is a task management product that allows construction managers to better orchestrate the construction process. With the ability to assign particular tasks to specific individuals, save notes and images, review a 3D model and construction documents, and track workers on site, a superintendent can keep much better tabs on aspects of the job and managers can have a continual progress update on how the work is progressing.
Data for Galactic Growth
Roni Bahar, Exec. Vice Presedent of Development & Special Projects - WeWork
WeWork is a company that offers coworking office space worldwide via an hourly or monthly subscription model. In the last four years they have seen exponential growth leading to construction on an unprecedented scale to accommodate demand (12 new office locations in just the last year). In an attempt to manage this frenzy they have embraced modular construction as a method for standardizing construction technique, aesthetics, and material cost regardless of location or contractor. The kitchen units, cubicles, conference rooms, bathrooms, and common area furniture are all modular components built in Revit complete with detailed finish information, material takeoffs, and construction details. As much of a well-oiled machine the procurement and development arm of WeWork is, it was fascinating to hear that the one lacking component to the process is hard data and feedback. With such rapid growth and a relatively small project team, the company is building offices faster than research can be conducted to determine the success of the spaces they are producing. In the next few years as the WeWork begins to catch up with the pace, it will be interesting to see how they aggregate data to substantiate the success of the experience beyond sheer number of offices and dollars.
More on WeWork...
The BUILTRFEED team were also at the event and posted an excellent summary.
Check it out!

I recently read the book "The Glass Cage: Automation and Us" by Nicholas Carr and was inspired by his message of the growing advantages and dangers of technology, particularly pertaining to design and architecture.
Carr says, "Technology is as crucial to the work of knowing as it is to the work of production. The human body, in its native, unadorned state, is a feeble thing. It's constrained in its strength, its dexterity, its sensory range, its calculative prowess, its memory. It quickly reaches the limits of what it can do. But the body encompasses a mind that can imagine, desire, and plan for achievements the body alone can't fulfill. The tension between what the body can accomplish and what the mind can envision is what gave rise to and continues to propel and shape technology. It's the spur for humankind's extension of itself and elaboration of nature. Technology isn't what makes us 'posthuman' or 'transhuman', as some writers and scholars have recently suggested. It's what makes us human. Technology is in our nature. Through our tools we give our dreams form. We bring them into the world. The practicality of technology may distinguish it from art, but both spring from a similar, distinctly human yearning."
Autodesk University
AU2014 Summary
December 2-4
Mandalay Bay, Las Vegas
Fusion 360 Digital Fabrication Workflows:
This course highlighted several features of Autodesk Fusion 360, a program that facilitates easy manipulation of 3D geometry otherwise difficult to achieve in Revit. After exporting a conceptual mass family from Revit to Fusion 360, an undulating wall form was created that could then be imported back into Revit, populated with curtain wall using adaptive components and rendered in a perspective street view with Google Maps background. That same form was imported into a program called Meshmixer that provides advanced options for preparing an STL file for 3D printing and allows you to apply custom supports. Altogether, the integrated workflow across several software platforms was relatively seamless and the course exhibited proof that very complex and customized geometry to be created in Revit for any project type.
Building a Good Foundation with Revit Templates:
Members of the architecture, engineering, construction and manufacturing industries gathered for this round table discussion about best practices for starting a project in Revit. Two methods were compared, the use of a Template File and Default Project. At Shepley Bulfinch, we use a template file at the outset of every project that contains a minimum amount of views, families and general standards to provide a good starting point. A default project has the advantage of carrying much more initial information including pre-placed families and objects but requires a significant time investment to keep the content current. Overall, the common sentiment in the room was that template files are easiest to maintain and offer the most versatility for any project type. Additionally, it is preferable not to “front load” Revit models and start out with unnecessary file size when one of the biggest challenges among all projects is keeping the model as small and responsive as possible.
Energy Analysis for Revit:
Are you familiar with the native energy analysis tool in Revit (hint: it’s under the Analysis tab on the ribbon)? This tool has the potential to be very helpful for early feedback to help drive the design. The task can be farmed out to the cloud for faster processing and to post reports for multiple options. For more in-depth analysis, the Revit model can also be exported to GBSxml format and opened in Green Building Studio, a cloud-based energy simulation platform. Relatively specific configurations are required within a model for the analysis to run successfully and one of the predominant takeaways of the course was the emphasis on modeling with energy analysis outcome in mind from the start of the project.
Challenges of LEAN Design and Computational Analysis:
This very engaging roundtable discussion examined the emerging role of computational analysis and generative design to help make more efficient design decisions. The keynote address at the beginning of the conference featured the use of "machine learning algorithms" where information and constraints are entered into a computer and simulations are run to determine an optimal design outcome. To start this session, we identified wastes and ineffective behaviors within each profession and in the collaboration process between. After a predictable round of architect-bashing, the question was proposed: "Does computation and simulation allow us to come to confident solutions earlier in the design process and reduce waste?" If existing condition information, user requirements, code constraints and many of the other variables that influence the design process can be programmed to generate permutations, is this a promising direction for the future of the profession? The group came to the conclusion that computational analysis and simulation will never be reliable enough to deliver a comprehensive design solution but may be helpful in providing direction at challenging moments in the process.
Practical Uses For Dynamo Within Revit:
Dynamo is a visual programming environment that allows you to make custom changes within Revit and extract information otherwise unattainable with the native program features. The program utilizes a user-friendly graphic interface to make adjustments within the Revit API (the "back end" which contains all the building blocks for how the program functions). This course demonstrated many entry-level uses for Dynamo including:
Utilizing Revit Models for Architectural Visualization:
This course covered work flow and best practices for exporting a Revit model to the Unity 3D, a game engine that enables real-time visualization and walk-throughs. The first step is preparing the Revit model for export by cropping down only what you need with a section box and turning off unecessary categories in Visibility Graphics. Export the model to FBX and import it to 3DS Max where materials, cameras and lights are applied. Lastly the model is imported into Unity where perspectives, walk-throughs and animations can be utilized. In summary, Unity 3D provides a compelling presentation piece that may appeal to some clients but it is important to consider the time investment that goes into the preparation process.
Dynamic Energy Modeling:
An energy and environmental analysis consultant presented a multitude of methods for assessing daylighting, wind, weather, energy consumption and other performance characteristics of a design. Specific tools covered included eQUEST, Green Building Studio, Autodesk360 Lighting Analysis, raytracing and raycasting, Rushforth Tools Library, Autodesk Ecotect and more. Although these programs were generally too advanced for the level of in-house analysis we use at Shepley Bulfinch, I enjoyed learning about numerous ways information can be extracted from Revit and used to help inform the architectural design process.
Revit + Dynamo = The Building Calculator:
Beyond parametric modeling and making tweaks within Revit, Dynamo can be used to extract much of the information stored within a model. By using an "export to excel" function, areas, quantities, dimensions, room lists and so much more can be exported and analyzed with the powerful tools Excel has to offer. Schedules can be created, complex building calculations can be scripted and automatically updated upon every change within the model, or checks and balances for code and zoning can be integrated to produce reports. Items can then be adjusted, renamed or resized to push back into Revit from Excel and make direct changes to the model. Dynamo provides a giant step forward in the pursuit of harvesting the full potential of BIM.
The Great Dynamo Dig: Mine Your Revit Model:
With all this excitement surrounding Dynamo, did you know there is also a SQL export function? This allows for the creation of a much more comprehensive database that can be thoroughly organized using database management software and mined for analytics and appealing visual graphics in Tableau.