Common Selection Methods Using Dynamo


The Dynamo visual programming add-in for Revit enables advanced information gathering, rapid model changes, and repetitive task automation previously not available with the out of the box tools. Working with robust Building Information Models often requires surgical list management -- the act of gathering, filtering, re-structuring, sorting, or otherwise altering clusters of data or information. Of all possible list management operations, the ability to target and isolate information is essential. In my experiences using Dynamo I have encountered many methods for selecting and isolating model elements, parameters, and numeric values in Revit. The following are some of the most common approaches that I find myself using time and again.


SELECTION BASICS:

As an introduction to selecting items from a list I will be using the English alphabet (26 characters) as my dataset and I am searching for the letter D. Below are descriptions for four of the most common selection nodes. Notice how the output of each use a "true" or "false" value. This is called a boolean operation -- a computer science term for anything that results an either of only two outcomes (binary): true/false, yes/no, 1/0, black/white, etc.

  1. Contains - this node produces a true/false result to whether the list contains any occurence of the letter D (plugged into the "element" input port). Although the outcome is true meaning yes the list contains the letter D, this will limit us from being able to isolate this letter in later operations.

  2. List.ContainsItem - similar to the Contains node, this node also searches the entire list for the letter D. However by changing the lacing to Longest -- right click the symbol in the lower corner (see red square), go to Lacing, and click "Longest" -- the letter D is checked against every item in the alphabet and the only true value returned is at Index 3 where D resides. The downside of this approach is that a sublist is created for every item in the alphabet meaning that we would need to flatten the list -- collapse everything back into one list of true/false values -- before continuing on to further operations.

  3. String.Contains - this node is excellent for searching through lines of text for a particular word or select group of words. In this case since the alphabet list only contains a single letter at every index, this node can be used to find the letter D. However, if the list contained the names of fruit and we searched for the letter "a", the node would return true values for any word containing an "a" such as banana, apple, pear, etc. For this reason, using the node to search for singular items can be problematic.

  4. == (match) - the double equals sign is a symbol that comes from computer science where a singular equals sign indicates a math calculation therefore two equals signs means that something is "the same". This is my favorite node to use for selection operations because it will find matches for any input type whether a string, number, piece of geometry, or Revit element.

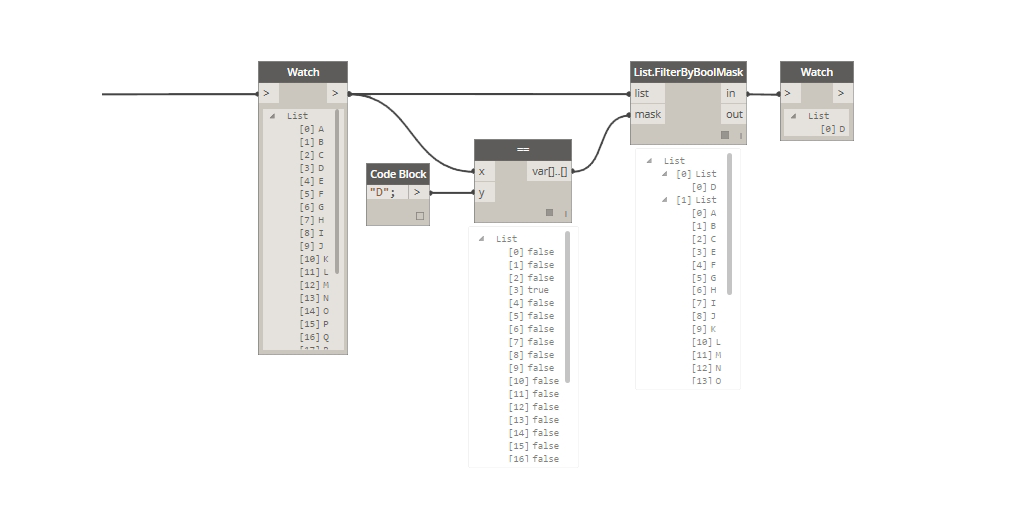
After using the contains/match nodes above to determine true/false values, the output can then be paired with the List.FilterByBoolMask node to split the outcome into two separate lists. In this case, using the == node generates a true value at Index 3 and false for all the rest. This list of true/false values is plugged into the List.FilterByBoolMask node as a mask to filter the original alphabet letters. The outcome is the letter D isolated into its own list.


SELECTING MULTIPLE ITEMS:

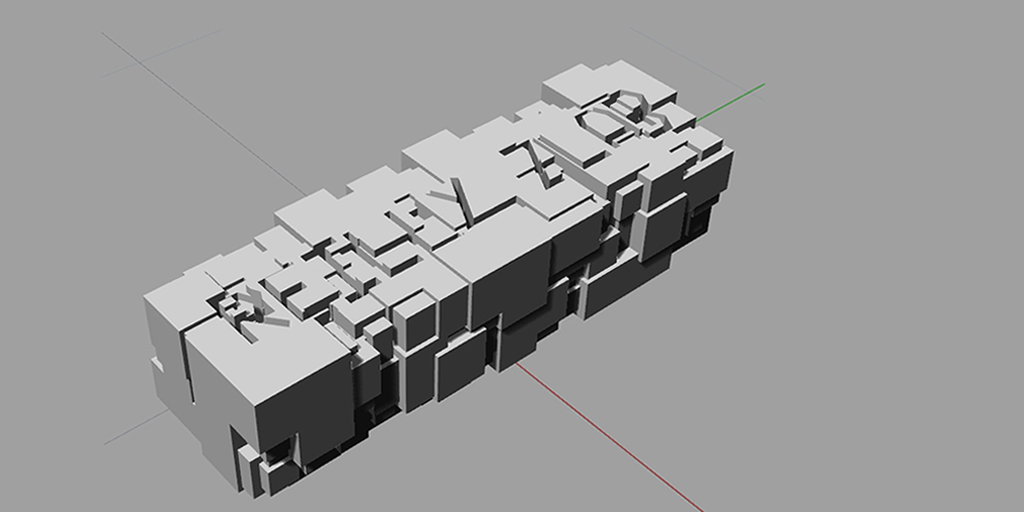
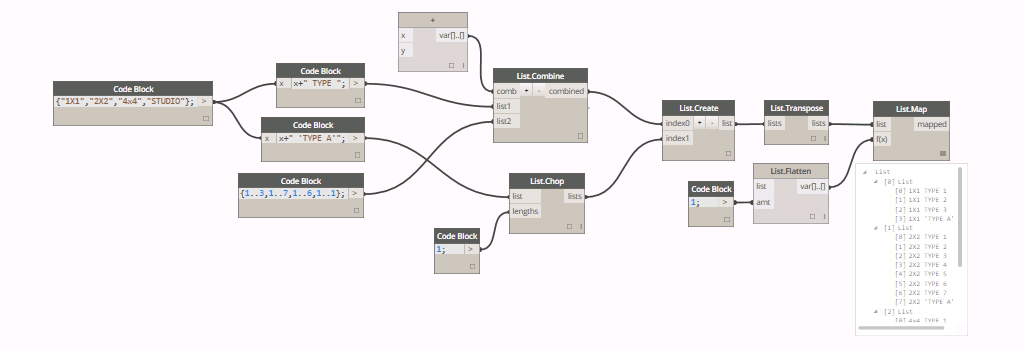
Oftentimes when working with a BIM model, you are looking to match multiple values at once. Building on the list management principles above, you can easily search the alphabet list for more than one letter. Inputing more than one letter into the == node requires that you switch the lacing to "Cross Product" (see small red square) because you are attempting to match multiple items against a list of multiple items, meaning that you need to pair all possible combinations. The result is a list of 3 true/false values for each letter in the alphabet since the == node is attempting to match the letters F, R, and X for each. Since we are checking for any match of those three letters, using the combination of List.Map and the List.AnyTrue node from the Clockwork package will comb through each list and identify whether any matches occur. The last step is to feed the new list of true/false values into the List.FilterByBoolMask node and the letters F, R, and X are separated from the rest of the alphabet.

I recently discovered a second approach to isolating a list of search items. Using the NullAllIndecesOf node from the SpringNodes package combs through a list and returns the Index number of any matching items. This can then be used in concert with the List.GetItemAtIndex node to extract the values from the original list at the matching indeces. This node works especially well if the list being searched has repeat instances of the values you are searching for. Also notice how there is no more need for the use of boolean (true/false) values as an intermediary step.


ADVANCED SELECTION - REVIT ELEMENTS:

The above list management principles can be applied to isolating and extracting elements from Revit. For example if you want to gather a list of all the chair families placed in a Revit model:

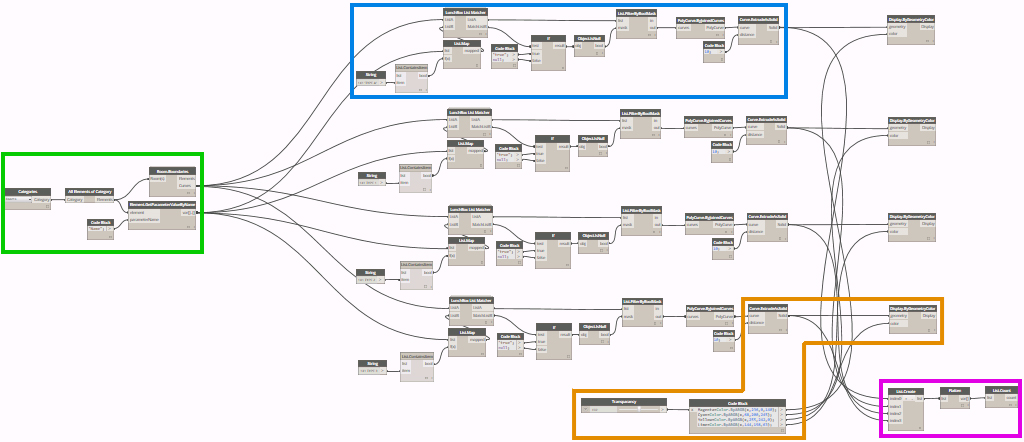
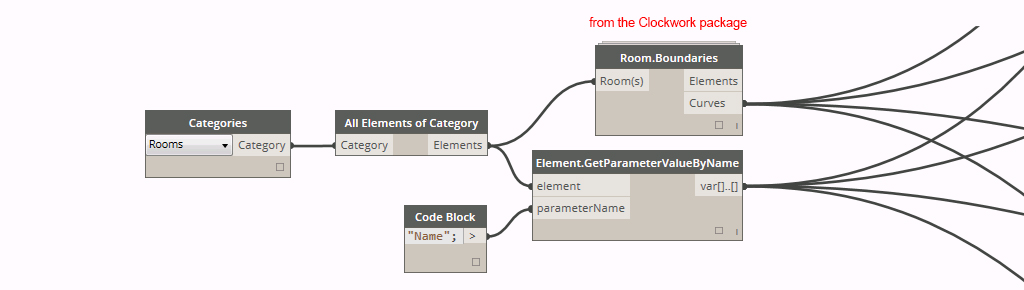
  1. The combination of Furniture in the Categories node and All Elements of Category will generate a list of all furniture families.
  2. Since we only want chairs, grouping the model elements by their family name will create organized sublists.
  3. The grouped sublists can then be searched for the word "Chair".
  4. Since the model elements are grouped in multiples of the same family, the combination of List.Map and the List.AnyTrue node from the Clockwork Package will check every sublist to see if any of the items contain a true boolean value for the text "Chair" in the family name. Another method for doing the same thing would be to use List.Map in concert with List.FirstItem, which would extract only the first true/false value from every sublist.
  5. The last step is to use List.FilterByBoolMask to filter out only the grouped sublists of Revit model elements that contain a boolean value of true.

One advantage of understanding list management principles is that tasks can be achieved from multiple approaches. Here is another variation of the above method for collecting all chairs in the model:

  1. Use the nodes Categories: Furniture and All Elements of Category to extract all of the furniture families.
  2. Get the name of each family and look for those that contain the word "Chair".
  3. Filter out all elements that did not yield a true value using the List.FilterByBoolMask node. As a means of verification you can insert some Count nodes to check how many families have been identified as chairs vs. other.
  4. Given that all of the model elements coming from the In output port of the List.FilterByBoolMask node, the final operation is to group all of the elements according to their family name. In theory this will get you the exact same results as the previous method.

There is an even easier way to select model elements, once again by using the NullAllIndecesOf node from the SpringNodes package:

  1. Collect all furniture families from the model.
  2. Use the NullAllIndecesOf node combined with the name of the families and the List.UniqueItems node to identify the individual indeces where matching items reside in the list and group them according to their shared family names.
  3. Feeding the sublists of indeces into List.GetItemAtIndex will extract the model elements from the original furniture list and group them accordingly.
  4. The last step would be to filter out only the chair family groups (not shown in the image).

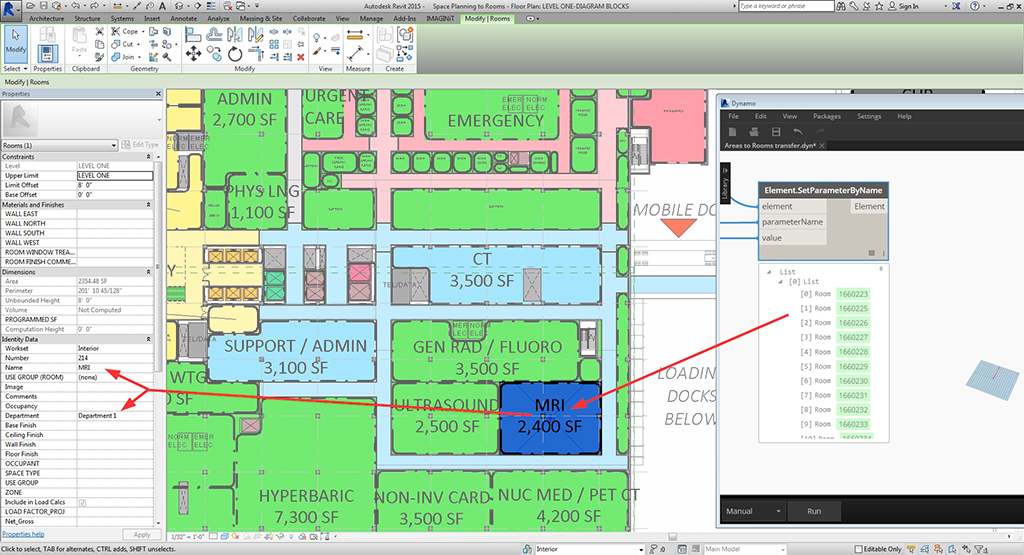
Specific families or parameter values can be isolated using the == (match) node:

  1. Collect all furniture families from the model.
  2. Use the == node to compare a specific chair name against the list of family names to produce a list of corresponding true/false values.
  3. Filter out all of the Revit model elements that contain a true boolean value with List.FilterByBoolMask.
  4. Optional: apply a Count node to get the total number families placed in the model for that specific item.

Please keep in mind that these examples are only some of the methods for selecting and isolating items using list management and they may not necessarily be the best methods. Different tasks and model configurations will require different approaches but the more time spent practicing list management, the easier it will become to customize a solution for any problem.

For more on list management I highly recommend that you take a look at Chapter 6 of the Dynamo Primer . Also, check out this excellent post by LandArchBIM .

When 'Moneyball' Meets Ski Racing

This winter I joined an adult ski racing league and got back into the sport for the first time in over a decade. Each week racer performance is entered into a complex scoring rubric that determines overall team standings. After seven weeks of racing, this rich dataset was too tempting for a data visualization enthusiast like myself to pass up.

How the scoring works:

  • Each team consists of four members, they can be any combination of males and females.

  • Races occur once a week and two courses are set side-by-side, one red and one blue.

  • Every racer gets two runs per race, once on each course.

  • The racers are ranked according to previous week performance and are paired up by number, this means that you are racing an opponent on every run.

  • 2 Points are awarded if you earn a faster time than your opponent on each run. If your opponent does not show up to race that night and you succesfully finish your run, you receive an easy Win.

  • 2 Points are awarded if your time on a particular course is faster than the time you earned on that course (red or blue) the previous week.

  • Up to 4 Points are available if you earn a time within a given handicap time range. The breakdown of these times is as follows:

How the adjusted handicap time is calculated:

  • Every week, one or two pacesetters will ski the course before all the racers. Their times are divided by their individual nationally-certified handicap percentages to determine the best possible time on that particular course.

  • The fastest of the two pacesetter times is then multiplied against all of the other racers’ times to determine each person’s adjusted handicap time.

[To become certified, they attend a Regional Pacesetting Trials event where their top times are compared directly to those of US Olympian, Ted Ligety. To learn more about pacesetting, CLICK HERE.]

Back to scoring:

  • Each week racers can earn up to 12 Points for their team.

  • The top three highest scores from each team are taken and added to the team’s overall total.

  • At the end of seven weeks, the top 5 teams from each night of the week (Monday-Thursday) are qualified to compete in one final championship race. The highest scoring team wins.

At first the results were posted as paper print-outs which resulted in a few hours of manual data entry to build the initial database. After establishing a database, complex calculations were required to reverse engineer the scoring system and then emulate the score keeping based on each racer’s weekly results. Once again I turned to Dynamo’s visual programming capabilities to build a tool that could process all of the information.

Eventually the Nashoba ATR staff began posting the results to their website on a weekly basis which eliminated the need for both data entry and using Dynamo to compute all of the adjusted times and scoring. I could then quickly scrape the latest data each week and dump it into an excel spreadsheet where specific metrics were calculated. After using the handy data reshaper add-in for Excel, each spreadsheet was pivoted and then imported in Tableau for visualization. Now the performance of teammates against the rest of the league could be easily understood graphically:

As well as overall league standings:

The complexity of the scoring system made for a relatively fair, enjoyable, and competitive experience regardless of age or gender. It also created some very interesting visualizations such as the breakdown of scoring by age and gender for the first four weeks:

And the median age and time per race:

[Notice how the more “experienced” racers generally smoked the rest of the field.]

Ultimately the data helped me quickly understand the league and identify the nuances in scoring that could help improve my performance. It felt to get back out in the course after so many years, I cannot wait to do it again next season!

Shout out to my teammates and special thanks to Nashoba Valley Ski Area for generously posting results online and weekly updates. The original dataset can be viewed HERE.

Design Space Exploration with Dynamo


One of the most challenging aspects of the architectural design process is determining how to organize form to fit an overall parti. Facing endless possible geometric configurations, making sequential alterations towards a fitting result can be difficult without a means to measure suitability. During the initial phases of design research, an architect gathers essential information such as program requirements to meet a clients needs, zoning and code information for a provided site, environmental and material influences, and aesthetic preferences. These assets serve as the foundation for a constraints based design approach where parameters can be assigned in an effort to influence and control form.

Constraints in design are rules or vocabularies that influence form through the design process. An inherent feature of the architectural process is that design must be performed within a set of given parameters. Parameters help to focus the scope of an architect by narrowing the range forms and formal relationships may take within a design solution... Constraint based design takes the parameters associated with a design problem and links them to the attributes of the formal components and relationships of a solution. (Dustin Eggink, http://goo.gl/EktbQ1 )

Dynamo is an ideal platform for constraints based design because the visual programming environment allows you build a parametric model that can be quickly adjusted with changes to input values.

Once you have a functioning Dynamo definition, all of the nodes can be consolidated into one Custom Node by dragging a selection window over everything and going to Edit > Create Node From Selection. This will transition everything to the custom node editing mode -- you can always tell when you are in this mode because the background is yellow.

To create a custom node, the first step is to give it a name, description of what it does, and category (where it will be saved in the Library). All of the input number blocks (far left side) must be swapped out for Input nodes, generally named for the variable they represent. Output nodes also need to be added after the final nodes in the definition (far right side) that are providing the finalized geometry. When these steps are complete, save the node. Back in the Dynamo node space -- also known as the canvas -- number sliders can be added to the newly-created custom node. It is helpful to click the down arrow on the left side of the node to set the minimum, maximum, and step interval because large numbers can take awhile to process or crash Dynamo while zeros will often create null values and turn the majority of your definition yellow with warnings. Now you have a fully parametric custom node that allows you to explore a range of formal configurations with the simple adjustment of number sliders.

Developing custom nodes for form making allows for use with the Dynamo Customizer -- a web-based viewer currently in beta for viewing and interacting with Dynamo models real-time. This platform has a lot of potential for sharing designs in the future and allowing colleagues or clients to experiment with their own manipulations of the design.

Check out this example for the twisting tower here: Dynamo Customizer - Twisting Tower.
DISCLAIMER: you will have to request Beta access and sign in with your Autodesk ID to view this. For step-by-step instructions, visit: http://dynamobim.org/dynamo-customizer-beta-now-available/.

After guiding parameters have been established, a design space can be generated for testing all possible variations of a few select variables of a design. Design space exploration is a concept involving a virtual -- or non physical -- space of possible design outcomes. This allows the designer to simultaneously see a wide range of options and extract only those that satisfy pre-determined criteria of fitness.

The core essence of this workflow is the use of Cartesian product which facilitates comparison of all possible pairings of variables. This mathematic operation can be understood as an array of combinations between x, y, z and 1, 2, 3 (below left) or as a slope graph of all possible correlations between the two lists of variables (below right).

Using the List.CartesianProduct node calculates all possible combinations of the number range values however all of the geometry is instantiated in Dynamo at the origin point, making it appear that only one object was created even though the count shows 132 (below left). Thanks to Zach Kron and the Design Options Layout node from the Buildz package, the nested list clusters of geometric objects are arrayed according to the Grid Size spacing value (below right). Using list management logic -- such as List.Transpose, List.Map with List.Transpose, etc. -- before the Design Options Layout node will re-arrange the list structure and result in different compositions of objects.

To set up a design space in Dynamo, the inputs to the custom node are fixed values. Whichever variables that you want to test must be left empty on the custom node and number ranges are connected to the List.CartesianProduct node. The number of list inputs in List.CartesianProduct must match the number of inputs left open on the custom node. It is also important to note that the list order for the number ranges in the List.CartesianProduct node must correspond to the same order of inputs in the custom node. The total number of values from each number range will not only determine the scale and form of the resultant geometry but count of values in each list will determine the overall size and shape of arrayed objects -- this is critical to remember because an excessive number of input values may take several minutes to process or potentially crash Dynamo. After the ranges of values have been set up, the List.CartesianProduct node is connected to the Design Options Layout node which arrays all possible combinations in 3D space. Depending on the geometry being tested, the Grid Size input determines the spacing between objects. When everything is connected correctly, Dynamo will display an array of forms which can be altered by changing the number range inputs and re-running the definition. If Dynamo crashes, geometry disappears, or there is an insufficient amount of variation in the forms, continue to calibrate the number ranges and explore the limitations of the parameters in your custom node.

A successful design space arrays all possible options along two or more axis utilizing the concept of dimensionality. Design space is theoretically unlimited, however the visualization of the virtual design space is limited to the constraints of graphic representation. Color can be added to provide visual differentiation of a third dimensions such as the analysis of generated outcomes, or could represent any of the associated properties of variables. Criteria for evaluation of fitness refers to the means by which the best solution is determined.

For example, a calculation of height of twisting tower forms can be colorized on minimum to maximum gradient (below left). Another representational technique is selective omission or hierarchical modifications to the representation (below right).

Ultimately design space and its subsequent representation is nothing more than a tool, designers still have to make decisions. Design space should function as a method of exploration to make informed, confident, substaintiated decisions.


Portions of this blog post were developed in collaboration with Jamie Farrell for our course Advanced Revit and Computational Workflows taught at the Boston Architectural College.

Dynamo-litia Boston - January 2016

As the Dynamo visual programming add-in for Revit continues to emerge as an essential tool for design and production, questions surrounding justification and strategies for implementation have arisen. Recent topics for discussion include the emerging role of computational design, open source vs. proprietary development, and funding innovation. The advantages and capabilities are well documented but what sort of impact can be expected on staffing and project planning? Please join us to hear more about how Dynamo is being managed in the local community and contribute to the ongoing conversation of how firms can better position themselves.

The video and presentation slides are available HERE .

More information at the Boston Society of Architects .

Canstruction

Image courtesy of Hung Pham

Image courtesy of Hung Pham

Canstruction is an international competition where “cansculptures” are created using cans of food, which are later donated to local hunger relief organizations. This year, the Houston office of Shepley Bulfinch assembled a team to take on the challenge.

After coming up with a design concept, the task of estimating the number of cans and positioning for structural stability is daunting. Since cans of food are a modular unit with standardized dimensions, this is a perfect opportunity for parametric design using Dynamo.

PREPARATION
The first step was to figure out how to populate cans along a surface. Following a visit to a local grocery store for research, the height and diameter of a chosen can were entered into Dynamo to establish the base module. An undulating vertical cylinder was created to a height of 6 Feet and cross-sectional circumference curves were cut based the height of the can.

Points were then placed along the horizontal curves at a repeated distance of the width of the can. In order to ensure structural stability, the last step was to offset the location of the points along every other curve by the distance of half a can width so that they would be perfectly staggered to land at the point of intersection of two cans on the level below.

DESIGN
For the final design concept, the character Blanky from the animated classic The Brave Little Toaster was chose to help convey the message “Stitching Away Hunger!”

The initial 3D object to visualize the Blanky’s body was created using NURBS in Rhinoceros and then imported into Dynamo using the Mantis Shrimp package from Archi-lab . Initial attempts at generating curves from the Rhino surface resulted in a significant loss of definition of features due to the NURBS curves in Dynamo rounding off sharp corners between points.

MODIFICATION
It was determined that a better approach would be to model the concentric curves, similar to a digital topography model. The geometry was transitioned to Revit where contour lines were generated at a vertical spacing of the height the can. As splines in Revit, the contour lines could be easily adjusted to maintain the precision of the shape’s features.

Dynamo facilitated a seamless iterative design process as the contour curves were adjusted in Revit then queried in the definition to populate with cans. Upon visual inspection of the resulting 3D geometry in Dynamo, further adjustments could be made to the curves in Revit to perfect the overall shape.

REINFORCEMENT

Cans tend to become unstable after a certain number of stacked layers so a common practice is to add a thin layer of supporting material at regular intervals to provide a firm horizontal surface. The team chose 1/16” medium-density fiberboard (MDF) as their horizontal reinforcement layer at every level of cans and added supplemental contour curves in Revit to simulate the 1/16” spacing. The curves were picked up in Dynamo and populated with an extruded surface to and visualize the addition of supports, as well as calculate the increased overall height.

To emphasize the distinction between the character’s cape and the void below, the decision was made to use taller cans of a different color for the lower central portion of the can sculpture. In order to account for this design alteration, the contour curves were strategically split in Rhino and – at areas to be substituted with larger cans – contour lines were removed to account for the increased height.

TAKEOFFS

One of the most significant benefits of designing a Canstruction sculpture with computation is the ability to perform an instantaneous takeoff of cans and materials. For this cansculpture, the final count came to 1763 short cans and 120 regular cans. In addition, there were 42 layers of support material, which ended up requiring [60] sheets of MDF. These numbers were critical for designing within budget and placing supply orders.

Image courtesy of Billi Jo Galow

Image courtesy of Billi Jo Galow

TEMPLATES

Linework from Dynamo can be pushed back into Rhino or exported as an SVG file. In preparation for build day, the assembly team printed out full-scale templates at each level of the cansculpture, which allowed them to quickly place cans on top of the template, eliminating most unforseen variances and the need for improvisation in the field.

Image courtesy of Billi Jo Galow

Image courtesy of Billi Jo Galow

TEAM

Congratulations to the Shepley Bulfinch – Houston team for constructing an impressive cansculpture for a good cause. It was a pleasure to assist with the use of Dynamo and interoperability among several software platforms for simulation and delivery of their design. They demonstrated that visual programming is easy-to-learn and invaluable tool for integration into the design and documentation process, whether producing a sculpture made of cans or an entire building.

Claudia Ponce
Hung Pham
Julie Truong
Billi Jo Galow
Sandra Bauder
Stan Malinoski

Parametric Nameplate


In an effort to become better acquainted with geometry creation in Dynamo, I created a parametric nameplate. The design concept was a cluster of “randomly” sized squares to give the appearance of a pixelated brick.

To start, a solid array of points was generated.

To create the illusion of “randomness”, points were removed at random from the array using list management and the List.RemoveItemsAtIndex node. Solid cuboids of varying size were then instantiated at the remaining points.

Lastly, 3D text solids were generated and placed centered at the front of the cluster of randomized squares. By using a boolean difference function, the text was subtracted from all of the intersecting cuboids. With the boolean union all function, the resulting shapes were all conjoined to form a unified solid.

In preparation for 3D printing, I exported the final solid as an .obj file to Rhino. Tools such as _Check and MeshRepair in Rhino are excellent for quality control and making sure that an object is “watertight” - no holes or manifold edges - so that it will successfully print.

Whether sculptural objects or architectural forms, many designs contain cantilevered elements that are difficult to print with additive technologies such as a MakerBot. In this model, the variation in stacked cuboids created several locations where cantilevers occur. Autodesk makes an excellent application called Meshmixer that can help with this problem. Meshmixer offers the ability to create, modify, and analyze the fidelity of objects for 3D printing, however one of the most useful features is advanced supports. The model is evaluated and automatic, branch-like structures are generated to meet the underside of cantilevered objects.

The supports allow for flawless printing and easily break away from the model after the print is complete to reveal perfect cantilevers.

Converting Space Planning Families to Revit Room Elements


A few weeks ago at the, Dynamo-litia Boston meeting a fantastic question was raised:

After using the space planning objects for programming in Revit, what happens when you need to transition that information to rooms?

This poses a legitimate challenge because the space planning objects are families and the information associated needs to be converted rooms - fundamentally different Revit elements.

Just days after the Dynamo-litia meeting I was presented with the opportunity to transform a Revit model full of intricately-arranged space planning objects across multiple Levels into Revit room elements. With some effort in Dynamo, I found a way to extract the name, department, and other parameters from each space planning object and generate Revit rooms in exactly the same spot with corresponding information.

Areas to Rooms_definition.png

Using this workflow, 639 programming families became Revit rooms in just under 90 seconds.

The Dynamo definition collects all instances of the Space Planning families in the model, groups them by Level, and locates the centroid of each. Using the Tool.CreateRoomAtPointAndLevel from the package Steamnodes, a room is placed at each centroid in the list with their associated levels.

The one caveat to successful conversion is taking the time to model Revit walls between the space planning objects. Consistency in setting up walls between objects and maintaining thorough parameter information within the objects will eliminate the possibility of creating Not Enclosed or Redundant rooms. Worst case, if rooms are overlapping within the same enclosed area after running Dynamo, you know that the centroid of the room is at the center point of the Space Planning family and you can add additional walls between those centroids to create separation between room elements.

The last step is to remove or hide the visibility of the space planning objects from the model and then you can perform Tag by Category to tag all rooms on each floor.

Dynamo-litia Boston - November 2015


Dynamo for Production

For all of the advancements that BIM has provided to the AEC industry, operational constraints in Revit consistently challenge the efficiency of production. The Dynamo visual programming add-in for Revit has been widely praised for providing a means to overcome logistical limitations. With the potential for gathering and restructuring information and elements from the model, Dynamo adds an additional layer of control and automation to every project. How are firms using the technology to optimize production? What are the most common tasks being automated?

The video and presentation slides are available HERE .

More information at the Boston Society of Architects .

Bespoke Brick Design


MODULAR FACADES WITH DYNAMO
A few weeks ago I presented how Dynamo can be used for bespoke brick design.

I chose "Cloaked in Bricks" by Admun Design & Construction Studio as a precedent to replicate using Dynamo.

Images courtesy of Archdaily - http://www.archdaily.com/775030/cloaked-in-bricks-admun-design-and-construction-studio

Images courtesy of Archdaily - http://www.archdaily.com/775030/cloaked-in-bricks-admun-design-and-construction-studio

Since a brick is a modular unit, creating an array and selectively rotating targeted bricks is a simple exercise using visual programming and parametricism.

The resultant arrangement of bricks can then be easily imported into Revit for documentation.

Dynamo provides limitless opportunity for design customization. This example would be complex to construct but if you want explore simple brick patterning or color variation, this is an excellent methodology. Furthermore, this approach can be applied to any modular facade system including: other block types, stone, metal panel, perforated metal, precast concrete, etc. Start to finish, this entire exercise took approximately 4 hours to produce and document.

Dynamo for Digital Fabrication


CUSTOM MAGAZINE RACK
Recently I set out to create a custom magazine rack in an effort to cover up an unsightly electrical panel in the living room of my apartment. My first attempt at modeling design ideas in SketchUp proved to be very time consuming because every slight adjustment to the design required re-modeling entire portions of the geometry. Eventually I came up with the idea of building a parametric model using Dynamo that could not only explore many iterations with minimal adjustments but also could simulate materials and assembly strategies.

To begin, I created a solid form in Dynamo that reflected one of the designs I had refined during earlier studies in SketchUp. I then generated two additional solids and applied a boolean difference to carve out a mail slot on the top and a slot for magazines on the front. I set the magazine slot at an angle so that magazines could easily be inserted and the top portion of the covers would remain exposed to display their titles.

Another key consideration was how the rack would mount. I ended up settling on a 12” metal picture rail with a 1/2” front lip that could be inserted into a slot in the back of the rack and attached to the wall. To incorporate the slot, I created another solid for the void space that the picture rail would require and again used a boolean difference function to subtract from the full design.

Dynamo_full definition_FINAL.png

For materiality, I just so happened to have an excess supply of 1/8” thick Baltic Birch plywood lying around so I decided the form would be nicely defined by evenly spaced vertical wood fins. To simulate the wood elements in Dynamo, I created planes set perpendicular to the wall mounting surface, copied each plane 1/8” to imitate the thickness of the material, and introduced a parameter for spacing between the pieces of wood to evaluate visual density. The planes were then used to intersect the solid geometry and leave behind the isolated slices of the original form as a representation of the wood. The parametric constraints facilitated quick adjustments and counts in the Dynamo definition ensured an economy of materials by balancing the desired look with a reasonable amount of wood used.

The next step was to add cross-bracing for structural stability. End cap pieces were added to the top and bottom as well as a support piece in the center of the rack tucked alongside the picture rail. To guarantee precise and equal spacing of all the vertical baffles, intersecting geometry was subtracted and tolerances were added to interlock all the pieces together.

Dynamo_ends_snip.png

After all the geometry was finalized, each piece was rotated and flattened onto the same plane for export to SVG. I opened the SVG file in Adobe Illustrator and used the vector lines to laser cut all the individual components out of corrugated cardboard to construct a mock-up. The SVG file format can also be exported to a DWG or DXF from Illustrator for use in AutoCAD.

rack_mock-up.png

The mock-up revealed that some of the tolerances were too loose, causing the magazine rack to easily lean from side-to-side as a result of inadequate interlocking of the cross-bracing. The advantage of building a parametric model in Dynamo is that I was able to reduce the tolerances of all geometry in the model ever-so-slightly for a perfectly snug fit.

The final result was a magazine rack that serves as both functional and sculptural. This was an excellent learning opportunity for digital fabrication and most importantly provided yet another purpose for using Dynamo.

What I Use Dynamo For Nearly EVERY Day


PARAMETER CHANGE CUSTOM DEFINITION

Working on architectural projects in Revit requires changes to the parameters of model elements on a daily basis. If only a handful of items need to be adjusted, the parameters can easily be modified by clicking the elements one-at-a-time. Yet oftentimes decisions are made on the project requiring the change of dozens or even hundreds of elements throughout the model - an extremely time-consuming process when executed individually. Common mothods for making mass changes to model elements are through Revit Schedules or by exporting parameter information to outside applications such as Excel via Ideate BIMLink and similar add-in products. However, there is even easier way to accomplish this...

Using the Dynamo visual programming add-in for Revit, parameters associated with Revit elements can be isolated and changed with the simple arrangement of a few nodes. This method is much faster and provides greater control than can be achieved from schedules and other tools because specific criteria of the parameters can be targeted and isolated. Once the Dynamo definition is built, the tool can be re-used every time future parameter changes are necessary. For this reason, I implement this approach nearly every day on projects. This tutorial will show you how to build a parameter change definition of your very own.

STEP 1 - set up the definition:
The four nodes on the far left are: the Revit element category that you want to make changes to, the specific parameter that needs to change, the existing name or value, and the new name or value. The name of the parameter and the existing values must match the exact spelling and capitalization as in the model. These values can be verified by going to the Revit model and selecting one of the elements to be changed or by creating a schedule.

Parameter Change_1_original definition_edit.jpg

STEP 2 - package the definition into a custom node:
Drag a window around all the nodes to select and go to Edit > Create Custom Node.

Parameter Change_1_original definition.jpg

STEP 3 - name the custom node:
Fill out the Name of the node and write up a brief description of what it does. The Category is what the node will be filed under in the Dynamo library for future use.

Parameter Change_3_custom node details.png

STEP 4 - place custom node on the canvas:
This is what the finished product looks like.

Parameter Change_4_custom node.png

STEP 5 - input changes:
When creating a custom node from a selection, Dynamo will automatically assign inputs to all open variables. To make a tool that can easily be understood by other future users, it may be beneficial to change the names of the Input nodes.

STEP 6 - putting the custom node to use:
Match the requisite Revit element Category, parameter name, and values to quickly change all instances of a particular element in your model.

ABX2015 Workshop - Computational Design on Every Project

Image: courtesy of Paul Kassabian

Image: courtesy of Paul Kassabian

Architecture Boston Expo 2015
Hosted by The Boston Society of Architects (BSA)
Boston, MA
November 19th, 2015

Welcome to Tomorrow:
Computational Design on Every Project
Paul Kassabian - Simpson Gumpertz & Heger (SGH)

Computational design technology allows designers and engineers to eliminate the repetitive "grunt work" inherent in every project. Automation was introduced during the Industrial Revolution and digital programming for automation arrived with the invention of computers, resulting in considerably increased efficiency for many industries. Tools for producing buildings have evolved immensely over the years - from analog to digital and now ever-changing software platforms - therefore it is imperative to stay flexible and ready to adapt to emerging technologies. Ultimately, the key is making tools work for us in order to ensure continuous improvement of the process for design and construction.

Current design software can be organized into three approaches:
1. Geometry - Rhino & Revit
2. Logic - Grasshopper for Rhino & Dynamo for Revit
3. Performance - software & custom add-ins for: daylight studies, structural analysis, building performance, etc.

And most computational approaches can be broken into three main categories:
1. RAD - Rapid Automated Drawings
2. RAY - Daylighting Analysis
3. RAP - Rapid Analysis & Planning

While Paul Kassabian appreciates the large and complex projects he often works on, some of his projects have been at smaller scales such as pavillions and installations where more experimental liberties can be taken. Regardless of size, invaluable lessons can be learned on any project.

One of the most interesting workflows presented was using custom code with Grasshopper and Rhino to generate structural beam and girder layouts for establishing maximum economy of materials. Structural members not only have prescribed sizes and connection methods but they also have an associated cost. By parametrically constraining the dimensions of each piece and including calculations for spacing and arrangement, the Grasshopper definition runs through hundreds of possible configurations simply by changing a few number sliders.

VIDEO - Parametric Steel Frame and MEP Layout

Even more impressive, a graph at the lower portion of the floor plan displays how Estimated Steel Cost fluctuates based on changes to the inputs (minute 1:35). This is a really impressive approach to showing cost sensitivity during the design process.

Another great project presented was a Grasshopper script that automatically generated a schematic structural layout while massing objects were manipulated in Rhino. This would allow an architecture team to model various design schemes and instantaneously understand the structural requirements. Rather than waiting days or weeks to get feasibility and cost estimates back from the structural engineer, this approach helps the architects design with structure in mind. The structural information from the finalized design can then be imported into Revit to provide a head start for the engineering team.

VIDEO - Master Planning Phase - Structural and Facade Systems Development

Lastly, Paul discussed the advantages of co-location over the traditional production process. On projects where he has the opportunity to work alongside the architect, he is able to gain a deeper understanding of the design and customize computational design tools that accommodate the intricacies of the overall vision. As opposed to the more traditional approach of exchanging digital files, the increased communication and flexibility from co-location has led to some of the most creative and alluring projects.

More information about the session can be found HERE.
About Paul Kassabian

AEC Technology Symposium 2015

AECTS2015_nametag.jpg

AEC Technology Symposium 2015
Hosted by Thornton Tomasetti (NYC)
Baruch College
September 25th, 2015

RESEARCH & DEVELOPMENT IN AEC SESSION 1:
Measurement Moxie
Christopher Connock - Kieran Timberlake

Christopher Connock emphasized the importance of approaching each architecture project as an experiment — an opportunity to test new technology and ideas — a philosophy that Kieran Timberlake incorporates into all of its projects. They are particularly exploring the frontier of data capture using a wireless sensor network to gather building performance analytics. The comparison of plant diversity and placement against soil moisture and temperature sensors in a green roof can help assess drainage, plant health, and solar gain over time. Temperate and relative humidity sensors can be used to investigate an entire space or focus on a particular application such as the performance of materials in a building envelope. Hundreds of different sensors placed throughout a building can track and transmit environmental changes across a given day or even across seasons. Kieran Timberlake implemented a wireless sensor network to help inform their renovation of their new offices in the Ortlieb Bottling Plant in Philadelphia and then developed an in-house app to capture post-occupancy feedback from their own employees about the overall comfort of the space and to identify abnormal conditions. All of this research contributed to the development of tally — a life-cycle assessment (LCA) app and add-in for Revit that evaluates the environmental impact of building materials among design options and promotes a much more eco-conscious approach to design.

Grow Up, Grasshopper!
Andrew Heumann - NBBJ

Andrew Heumann believes in the need to change the perception of design technology in the AEC industry and integrate it more into practice. He showcased an extensive portfolio of projects that have used Grasshopper for Rhino and custom written apps to simulate inner office traffic patterns and the importance of sight lines, the use of human location and city data for urban planning, and the tracking of digital tools in the office to identify focus areas for development and support. All scripts and tools developed in-house at NBBJ are documented and packaged into products for use by project teams. In addition, custom dashboards and user interfaces help reduce intimidation and increase universal adoption — for example, reducing a complex Grasshopper script to a series of slider bars that control the inputs of a parametric design. Andrew also advocated for the use of hackathons and similar hands-on user meeting formats to promote design technology as a facet of culture and process. He shared an example of how a brief hackathon with senior partners at NBBJ led to the funding of a proposal for further development of an innovative tool for optimizing healthcare patient room configurations.

Evolving Modes of R+D in Practice
Stephen Van Dyck and Scott Crawford - LMN Architects / LMN Tech Studio

The Tech Studio was founded to support the prominent role of research and development at LMN Architects in Seattle, which led to an expanded use of analytic and generative tools to drive design. They have not only embraced the use of custom digital tools for the creation and visualization of complex forms but regularly construct scale models for material testing and to explore modular strategies as part of their iterative design process. Working with fabrication in mind facilitates improved precision for collaboration with engineers and consultants. In addition, they have found that a thorough digital process and physical models help better communicate design ideas thus resulting in increased positive community feedback. The development of a ray-tracing tool for exterior acoustics studies, custom panel creation for balance in musical acoustics and aesthetics, and a highly parametric pedestrian bridge spanning a major Seattle highway are a few examples of projects that demonstrate how research is guiding principal for design at LMN.

OPEN-SOURCE DATA AND APPLICATION:
Collaboration and Open Source - How the Software Industry’s Approach to Open Sourcing Non-Core Technology Has Created Innovation
Gareth Price - Ready Set Rocket

This presentation provided insight to the current state of technological innovation through the lens of a digital advertising agency. Gareth Price emphasized that individuals should not be hesitant to share ideas out of fear that another company will benefit from them. Particularly in the AEC industry, companies do not have the overhead to for pay tool creation and requisite support, nor can they cover the cost to pay an outside software consultant. The reality is that other people are busy with their own work and do not have the time nor resources to steal your ideas and commodify them. More importantly, it is advantageous to share ideas for a project because they may elicit constructive criticism, or inspire others to contribute to those ideas and improve them. Also, do not get too entrenched on one idea and know when to pivot — the next great idea may come as an unexpected derivative of the original intention.

Key quotes:
"purpose is the DNA of innovation"
"failure is the new R&D"

How Opens Source Enables Innovation
Mostapha Roudsari and Ana Garcia Puyol - CORE studio / Thornton Tomasetti

Mostapha Roudsari and Ana Garcia Puyol exhibited many examples of digital tools that have emerged out of CORE Studio - the research and development arm of Thornton Tomasetti. The majority of examples presented originated during previous CORE AEC Technology Hackathons and were then further developed into more robust products. Nearly every tool required collaboration from multiple individuals, with expertise in a diverse mix of software platforms, and oftentimes representing different companies. The takeaway from this presentation was the value of open source and hackathons as a means for getting a group of talented people into one room to create new tools for AEC design and representation. Mostapha wanted to make it clear that more important than software tools, code, and machining is the strength and power of the user community. If you want to be at the forefront of the movement, be a developer, however the community is just as important make an effort to share ideas and spread adoption.

Here are some of the many tools presented:

  • vAC3: open source, browser-based 3D model viewer. This project led TT to further develop Spectacles.
  • Spectacles: allows you to export BIM models to a web interface that allows you to orbit in 3D, select layers, and access embedded BIM information (demo HERE)
  • VRX (Virtual Reality eXchange): a method for exporting BIM models for virtual reality viewing via Google Cardboard
  • DynamoSAP: a parametric interface that enables interoperability between SAP2000 (structural analysis and design), Dynamo, and Revit
  • Design Explorer: "an open-source web interface for exploring multi-dimensional design spaces"
  • Pollination: "an open source energy simulation batch generator for quickly searching the parameter space in building design"

For more information, check out TT CORE Studio's GitHub, Projects, and Apps pages

Open Source: Talk 3
Matt Jezyk - Autodesk

Matt Jezyk provided an introduction to Dynamo including its history and the most recent developments. Dynamo may have started as a visual programming add-in for Revit but it is quickly transforming into a powerful tool for migrating data and geometry across numerous software platforms. The talk highlighted the role open source has played in the empowering independent developers to create custom content that expands capabilities and makes interoperability possible. By keeping Dynamo open source, it has benefited from contributions by individuals with a wide range of expertise looking to satisfy specific requirements. As part of a larger lesson taken from the growth of Dynamo, Matt emphasized that the key to the emerging role of technology in practice and the AEC industry as a whole is less about learning specific tools but about codifying a way of thinking — tools are only the implementation of a greater plan.

DATA-DRIVEN DESIGN
Beyond Exchanging Data: Scaling the Design Process
Owen Derby - Flux.io

Flux has been a frequent topic of conversation lately. The company initially marketed a product called Flux Metro which boasted the potential for collecting the construction limitations of any property based off zoning, code, municipal restrictions, and property records — an ideal tool for developers and architects to assess feasibility or use as a starting point for the design process.

The company has since pivoted to focus on creating a pipeline for migrating and hosting large quantities of data for many software formats. Their new product line features an array of plugins for transferring data between Excel, Grasshopper, and Dynamo, with plans to release additional tools to connect to AutoCAD, SketchUp, Revit, 3DS Max and more in the near future. Data exported from these software programs is hosted to a repository in the cloud where it can be archived and organized for design iterations and option investigation. Flux has great potential for achieving seamless interoperability of data and geometry between software platforms, and significantly improving the efficiency of AEC design and production process.

Holly Whyte Meets Big Data: The Quantified Community as Computational Urban Design
Constantine Kontokosta - NYU Center for Urban Science + Progress (CUSP)

The NYU Center for Urban Science + Progress (CUSP) is using research to learn more about the way that cities function. Buildings, parks, and urban plans are all experiments built on assumptions in which the true results don’t emerge until years and decades later. How do you measure the “pulse” of a city? How do macro observables arise from micro behavior? Constantine and CUSP have set out to test these questions by collecting and analyzing: NYC public internet wireless access points, Citi bike share, 311 complaint reporting, biometric fitness devices, and social media. They use these urban data sources to make better decisions and form initiatives for future community improvement projects. The results also have positive implications for city planning, city operations, and resilience preparation.

Data-Driven Design and the Mainstream
Nathan Miller - Proving Ground

Nathan Miller is the founder of the Proving Ground, a technology consultancy for Architecture, Engineering, Construction, and Ownership companies. In his experiences providing training and technological solutions he professes the importance of equipping staff with the right tools and knowledge to adequately approach projects. There is an intersection between managers and leaders responsible for projects and staffing, and those who are actually doing the work. It is imperative to focus on outcomes and not get deterred by the process.

The Biggest IoT Opportunity In Buildings Is Closer Than You Think
Josh Wentz - Lucid

Energy consumption, mechanical systems data, thermal retention, and other metrics are not recorded for the majority of buildings worldwide. These are incredible missed opportunities for evaluating the overall performance of a building and collecting real-time research that can inform better construction techniques. Lucid has developed a product called BuildingOS that offers 170 hardware integration options to collect robust building data. This data has the potential for helping facilities management departments better track efficiency and maintenance of their systems, in addition to contributing to the international pool of data to help us better understand how materials and systems perform over time.

RESEARCH & DEVELOPMENT IN AEC SESSION 1
Capturing Building Data - From 3D Scanning to Performance Prediction
Dan Reynolds and Justin Nardone - CORE studio / Thornton Tomasetti

This presentation highlighted CORE Studio's use of various technologies for capturing existing conditions data and testing architectural responses through computation. They have utilized drones for capturing the condition of damaged buildings and structures by assembling fly-by photos into a point cloud.The development of in-house GPS sensor technology accurate to 1 centimeter anywhere in the world has enabled measuring the built environment and construction assemblies to a high level of precision. CORE Studio has also investigated the use of machine learning for exploring all possible combinations of building design parameters and calculating embodied energy predictions. All of these design technology advancements are helping Thornton Tomasetti design more accurate better-informed systems.

Data-Driven Design
Luc Wilson - Kohn Pedersen Fox Associates PC

Luc Wilson thinks of data as an “Urban MRI” - a diagnostic tool for measuring the existing configuration of cities and predicting future growth. Multiple FAR and urban density studies were presented that exhibited how comparison to precedents and benchmarks helps to conceptualize the data and make visual sense of the analysis. The key to prediction is the ability to test thousands of designs quickly, which Luc has perfected by developing digital tools for quickly computing all possible combinations of input parameters and producing measurable outcomes for comparison. One of the most exciting portions of the presentation was the mention of a 3D urban analysis tool called Urbane, which Kohn Pederson Fox is working with NYU to develop — could this be the new replacement for Flux Metro?

Cellular Fabrication of Building Scale Assemblies Using Freeform Additive Manufacturing
Platt Boyd - Branch Technology

Platt Boyd founded Branch Technology after realizing the potential for 3D printing at a large scale by imitating structures found in nature. Branch has dubbed their technique “cellular fabrication” where economical material is extruded with geometric complexity to construct wall panels that are lightweight and easy to transport. Their process seeks to reduce the thickness required by traditional 3D printing technologies and the intricate geometric structure provides equivalent strength to that of a printed solid. The wall panels are printed free-form with a robotic arm on a linear track and then are installed onsite where insulation, sheathing, and finish material are added to reflect the same condition as traditional wood or metal stud construction. It will be really interesting to see Branch continue to refine their methods and start to tackle complex wall conditions for use in real-life building projects in the near future.


Watch videos of all the presentations HERE.

Getting Started with Dynamo

I am frequently asked how I got started using Dynamo so I will take a moment to share my background and provide advice for making your first foray into the world of computational BIM.

I have been using Dynamo for less than a year with no prior visual programming experience and it has made a significant impact on the way I approach production. For all of the advancements that BIM has provided to the AEC industry, operational constraints in Revit consistently challenge the efficiency of production. Since entering the architecture profession, working on several project teams has revealed that every project requires repetitive tasks at some point, oftentimes meaning making changes to Revit elements one-at-a-time. To make matters worse, fluctuations in design direction, scope, or value engineering can necessitate a complete overhaul of portions of the model and lead to re-doing those consecutive manual adjustments. Dynamo adds an additional layer of control to overcome Revit limitations by providing the capability to gather and restructure information and elements in the model, thus creating the potential for repetitive task automation.

My best advice for getting started with Dynamo is to make time and find opportunities to use it. Identifying a specific problem will provide a framework with which to search for answers and guide your workflow. There are many wonderful developers out there who are sacrificing personal time to expand the capabilities of Dynamo and produce custom nodes for the Package Manager. In the spirit of Open Source, the worldwide community is generally willing to share knowledge and answer questions in the hope that more people will contribute ideas. It is important to keep in mind that demonstrations and documentation are intended to provide examples of what can be achieved. There isn’t a universal Dynamo definition that addresses multiple problems, every task requires slight modifications and customizations to correspond to the unique conditions of your project. Focus on the underlying principles of visual programming and embrace flexibility.

If you want to learn more about a Dynamo post you encountered, you can improve the chances for a quick response if you include sufficient information. I have had success in the past by including the following in an email:

  1. your question
  2. how long you have been using Dynamo
  3. what you are working on
  4. how you plan to apply this workflow
  5. what you have tried so far
  6. accompanying screenshots, sketches, diagrams

When it comes to resources, the tutorials on the Learn page of the Dynamo website are very helpful and I particularly encourage reading through the Primer to gain an understanding of the fundamental principles. Keep up with the latest news and tutorials by regularly checking the Dynamo Blog. The Dynamo Community Forum is an excellent place to post questions, responses are normally timely and everyone is friendly. Local Dynamo user groups have also been popping up around the globe, which are an excellent way to grow your network of individuals that you can reach out to for help and collaboration. There are currently groups in: Atlanta, San Francisco, Tokyo, Boston, Los Angeles, and Russia.

Lastly, there are many blogs produced by pure Dynamo enthusiasts that have helped me in my journey. I highly recommend that you check them out if you are looking for answers or inspiration:

Proving Ground (io) & The Proving Ground (org)
Archi-Lab
Buildz
Havard Vasshaug's blog
Simply Complex
What Revit Wants
Sixty Second Revit
AEC, You and Me
Jostein Olsen's blog
Revit beyond BIM
Enjoy Revit
Serial_NonStandard
Kyle Morin's blog
The Revit Kid
The Revit Saver
SolAmour's extensive list of resources

Listen to the Dynamo Team explain the history and recent popularity of Dynamo on the Designalyze Podcast.

Visualizing Rooms by Color with Dynamo

Using the Dynamo visual programming add-in, it is possible to isolate room geometry in a Revit model and color-code specific room types for the purpose of visualization. This workflow can be extremely helpful when trying to track down a lost room, visualize unit mixture, or analyze the adjacency and diversity of various rooms in the model. Ultimately this Dynamo method adds yet another tool that can be customized for a multitude of model validation tasks.

 FULL DEFINITION: Step 1 (green), Step 2 (blue), Step 3 (orange), Step 4 (magenta)


FULL DEFINITION: Step 1 (green), Step 2 (blue), Step 3 (orange), Step 4 (magenta)

Workflow:

Step 1: collect all Room elements from your Revit model by their room name parameter and then isolate the perimeter geometry of each.

Step 2: match the list of all rooms in the model against the name of one particular room you are looking for (String node in the red circle). Using the List.FilterByBoolMask approach, any null items (often due to unplaced or duplicate rooms) are filtered out that can potentially break the definition later on down the line. The perimeter lines of the filtered rooms are then used to generate a 3D extrusion of each room shape.

image 4.jpg

Step 3: the list of 3D room shapes is then passed to the Display.ByGeometryColor node to colorize in the Dynamo geometry preview mode. Each unique color requires an RGB color code. You can find custom RGB color values in Adobe Photoshop or Illustrator, or by going to websites such as Kuler and COLOURlovers .

image 4.jpg

Step 5: once the definition is set up for one room name, the central cluster of nodes can be copied for all other room names. If everything is correctly set up, a series of colored rooms will appear in the 3D geometry preview.

Step 6: for means of validation, a count can be taken of all rooms that have been collected from the Revit model and fully processed. Comparing this count to a schedule an Revit will verify whether all targeted rooms were accounted for and visualized in Dynamo or not.

With this approach, all rooms can in the Revit model can be queried, sorted, and visualized.

Additionally, this Dynamo definition can be simplified by utilizing advanced list management tactics, eliminating the need to copy the central of nodes for each unique room name.

PRCA Rodeo Map

Hebron Harvest Fair Rodeo - Hebron, CT

Hebron Harvest Fair Rodeo - Hebron, CT

Growing up in the agrarian state of Oregon, attending local rodeos during the summer was a favorite family activity. The raw athleticism, toughness, and tradition always made for good entertainment. The humility, sense of community, and incredible treatment of livestock instilled a deep admiration for the country folk for whom rodeo is their entire livelihood.

Unlike most professional sports, the cowboys and cowgirls are responsible for personally funding their own equipment, horses, lodging, and transportation. Their lives consist of driving hundreds, sometimes thousands, of miles between weekends to make it to the next rodeo where they compete for a paltry winner-takes-all purse in the 4-5 figure range. A missed lasso toss, a momentary loss of balance, or an overturned barrel can be the difference between earning enough to cover a few more weeks of food, gas, and supplies, or heading to the next event empty-handed. As if the meagre earnings aren’t enough of a deterrent, the physical toll and life-risking courage the sport demands are further testament to the passion and dedication these athletes possess.

Now having lived in Boston for the better part of a decade, my rodeo participation has been reduced to the occasional visit home or sporadic television broadcasts. Recently I was ecstatic to discover a rodeo in Northern Connecticut, however I had my doubts about the level of competition and authenticity. Given that the majority of rodeos occur in the western and southern portions of the United States, I wondered how much incentive an athlete would have to drive all the way to New England to compete. My curiosity got the better of me and I decided to look for a map of all rodeos in a given season of the Professional Rodeo Cowboys Association (PRCA), only to to find that no such map exists on the internet. Thus I set out to make my own map...

Data Acquisition:
The first step was to acquire the schedule for the 2015 rodeo season. The PRCA website does not contain a cohesive schedule for the entire season but does post the remaining season schedule as well as the results of each event that has already occured. Luckily the construction of the website is very simple, which made for easy scraping of the data into a format that can be processed.

PRCA 2015 Results
PRCA 2015 Remaining Schedule

Parsing and Re-structuring with Dynamo:
After collecting the lists of information for both the remaining schedule and results, I set out to use Autodesk Dynamo Studio 2016 to parse and re-structure the data for visualization. With the knowledge that the National Finals Rodeo event in Las Vegas in December marks the culmination of every rodeo season, I pared down all events to this timeframe, resulting in 620 total contests. This is a prime example of Dynamo as a powerful visual programming platform independent of Revit.

Visualization with Tableau:
The next step was to merge the two data sources and organize the information by: event name, city, state, country, and first day of event. Once everything was clean and consistent, I exported the data to Tableau for visualization. The Tableau map feature allowed me to position all 620 rodeos across the US and Canada and colorize them based on when they take place during the course of the season.

Takeaways:
In the end I was surprised to see a moderate cluster of dots in the New England region and was particularly pleased to find rodeos in Western New York, Massachusetts, Connecticut, and Maine. Perhaps there is a contingent of die-hard New England cowboys and cowgirls keeping the spirit of rodeo alive in the East? Regardless, my respect and admiration for this sport will always keep me coming back for more and I look forward to checking out the local rodeo scene. Enjoy!

Dynamo Studio "definition" for parsing and re-structuring the PRCA rodeo data.

Dynamo Studio "definition" for parsing and re-structuring the PRCA rodeo data.

How is Data Changing The Nature of Design?


This article was recently published on Building Design + Construction: article
And originally posted on the Shepley Bulfinch Insight Blog: article


At the BLDGS=DATA symposium in New York this spring, the discussion focused on strategies for harnessing the massive amount of data made available by modern technology. An increased capacity for analysis has led to immense data generation and an unprecedented ability to identify correlations. The AEC industry today is grappling with ways to make the best use of it and to develop standard processes for leveraging and sharing it.

This surge of data is changing the very nature of design as architects begin to embrace a much more data-driven approach. Advances in Building Information Modeling (BIM) allow for more thorough project documentation and the ability to share building information with contractors. Intricate digital models and environmental simulation enable offsite fabrication methods and building systems improvements that have the potential to increase quality and reduce construction costs. Most importantly, access to vast quantities of data is helping design teams better understand a client’s needs and can be used to validate a particular design decision beyond previously available means.

With an increased capacity for capturing data, it is imperative not to get lost in the white noise. The seemingly limitless stockpiles of information must be strategically vetted for meaningful interpretation with a focus on the value it provides to the process and the end product. One of the most evident attempts to find a balance between data and technology is the current infatuation with computational design, with its powerful new software platforms, intricate parametric tessellations, and innovative materials.

How can architecture make the most of the growing data movement? The true promise of this information age is not iteration and automation but the ability to substantiate expertise and predict outcomes.

To better position themselves to do so, architectural practices must acquire and develop new skills to be able to filter and find value in the newly available data sources. Computer science will become an essential component of design education and graduates will be encouraged to form much more integral partnerships with engineers, construction managers, and environmental sustainability experts. Architects must seek data collection and information management techniques to help inform their process, exhaust possibilities, and confirm design outcomes. The evolution of the practice of architecture is about changing our mentality and approach: broadening our thinking, not necessarily eliminating tradition. While technology is becoming a powerful tool, the most critical role belongs to the individual who, alone or as part of a greater whole, is harnessing that power.

Ultimately the AEC industry as a whole will benefit from an increasingly data-driven approach to design and construction that promotes improved communication, better quality projects, and fewer hindrances to the building delivery process.

-Kyle Martin


Kyle Martin is a member of Shepley Bulfinch’s architectural staff. He is a co-founder of the Boston Society of Architects Revit Users Group’s “Dynamo-litia” and currently teaches Advanced Revit and Computational Workflows at Boston Architectural College.